
To verify the above analysis, this study employs a multidimensional fixed-effects regression model to examine the impact of DT on enterprise innovation. The baseline regression equation is as follows:
\(In(Cit{2_{i,t}})={\alpha _0}+{\beta _1}D{T_{i,t}}+{\gamma _t}{X_{i,t}}+{\mu _i}+{\lambda _t}+{\eta _j}+{\varepsilon _{i,t}}\)
Where: \(In(Cit{2_{i,t}})\) represents IC of smart manufacturing enterprises,\(D{T_{i,t}}\)represents digital transformation,\({X_{i,t}}\)is a vector of control variables,\({\gamma _t}\) is the coefficient vector for the control variables, \(\mu _{i}\) represents province fixed effects,\({\lambda _t}\)represents year fixed effects(controlling for time-varying macro shocks), \({\eta _j}\)represents industry fixed effects(where \(j\) denotes the industry of firm \(i\) , controlling for industry-invariant traits), \({\varepsilon _{i,t}}\) is the random error term. To ensure data stability, relevant measurement data are logarithmically transformed.
To verify the pathway through which DT affects IC, we introduce the mediating variable \(Me{d_{i,t}}\) and employ the three-step mediation method, establishing the following regression equations. Additionally, building on this foundation, the Bootstrap method was employed to conduct mediation effect testing, thereby enhancing the robustness of the mediation analysis.
Regression of the mediator on DT:
\(Me{d_{i,t}}={a_0}+{a_1}D{T_{i,t}}+y{X_{i,t}}+{u_i}+{\eta _j}+{\varepsilon _{i,t}}\)
Regression of IC on DT and the mediator:
\(\ln (Cit{2_{i,t}})={\theta _0}+{\theta _1}D{T_{i,t}}+{\theta _2}Me{d_{i,t}}+{\gamma _t}{X_{i,t}}+{\mu _i}+{\eta _j}+{\varepsilon _{i,t}}\)
Where: \({\theta _0}\) are intercept terms, \(\theta _{1}\) represents the direct effect coefficient of DT, \(\theta _{2}\) represents the coefficient of the mediator’s effect, \({\eta _j}\) represents industry fixed effects, where \(j\) denotes the industry to which firm \(i\) belongs (controlling for time-invariant industry characteristics). Other variables and parameters are defined as in the baseline model.
Variables definition
(1) Dependent variable (IC of smart manufacturing enterprises): In academic research, IC of smart manufacturing enterprises is a multidimensional concept. This study focuses on its quality dimension, measured by the number of patent citations (Cit2). The rationale is that patent citation frequency directly reflects industry recognition, technological radiation power, and commercial application potential of technological achievements. Highly cited patents often contain more breakthrough ideas or solve common industry technical challenges, providing a more precise measure of the “quality” of IC than patent application counts alone. To meet the distributional assumptions of the econometric model, the natural logarithm of the patent citation count (LnCit2) is used, making the indicator more compatible with the normality assumption of linear regression error terms. Data for this indicator were derived from the raw dataset encompassing innovation capability, quality, and efficiency of listed companies. After sample screening (focusing on smart manufacturing firms) and cross-dataset matching (integration with DT data), it is incorporated into the analysis, ensuring consistency and validity of observations.
(2) Core explanatory variable (DT): Leveraging the 1999–2023 China A-share listed company dataset, this study constructs a text mining-based index. The methodology focuses on Management Discussion and Analysis sections of annual reports to develop a tripartite lexicon covering digital technology application, business process change, and organizational capability upgrade domains, incorporating over 50 core keywords. Following preprocessing steps including word segmentation and noise removal, keyword density is calculated as keyword frequency divided by total words per annual report. This standardization controls for document length heterogeneity, yielding the Digital Transformation index. Higher values indicate stronger strategic prioritization of digital and collaborative transformation initiatives.
(3) Mediating variable: Operating Expense Ratio (OER): Leveraging the Operating Expense Ratio as a mediating variable, this metric quantifies cost efficiency in core firm operations. Within the digital transformation to innovation capital pathway, OER functions as a crucial cost-resource transmission mechanism. It manifests through two interconnected dynamics. Firstly, digital technologies potentially compress operating expenses via process automation and precision marketing, enabling resource reallocation toward innovation-driven efficiency improvements. Conversely, initial-phase technological deployments such as digital platform development may temporarily elevate expense ratios, demonstrating a strategic investment dilemma characterized by the dynamic equilibrium between short-term cost expenditures and long-term innovation outcomes. These combined effects delineate digital transformation’s complex operational cost implications. The study derived OER data from annual financial statements of Chinese listed companies, incorporating industry fixed effects to control for sectoral variations including inherently elevated sales expenditures in service industries to ensure metric robustness in mediation effect testing.
(4) Control variables: This study selects the following control variables to isolate the influence of other factors on the core relationship:
Relative Capital Accumulation rate (RCA): Measures the growth rate of a firm’s capital stock relative to industry or economic benchmarks. It evaluates how efficiently an enterprise expands its productive assets compared to peers over time.
Capital Intensity (CAP): Quantifies capital investment per unit of output, calculated as total capital assets divided by total revenue or production volume. Higher values indicate greater reliance on physical assets rather than labor for value creation.
Total Assets (TA): Quantifies organizational scale using total book value of assets as the primary metric, reflecting a firm’s resource endowment and financial capacity. This measure is typically logarithmically transformed in empirical models to mitigate skewness and enable elasticity interpretation.
Fixed Assets to Total Assets Ratio (FATAR): Computes the proportion of immovable, long-term productive assets (PP&E) relative to a firm’s total asset base. This ratio reflects strategic commitments to tangible operational infrastructure.
Intangible Assets to Total Assets Ratio (IATAR): Measures intellectual capital and non-physical resources (patents, software, brand value) as a percentage of total assets. Elevated ratios signal knowledge-driven competitive advantages in innovation-centric industries.
Institutional Investors’ Shareholding Percentage (IISP): Measures the proportion of a firm’s total shares held by institutional investors. This metric reflects institutional monitoring intensity and influences corporate governance effectiveness through active engagement and voting power.
Shareholdings in Other Financial Institutions (SOFI): Quantifies a firm’s equity investments in banks, insurance companies, or other regulated financial entities. Such cross-holdings facilitate strategic synergies but may introduce systemic risk exposure and regulatory complexity.
Independent Directors’ Network Centrality (IDNC): Assesses an independent director’s influence within interlocking directorate networks using graph theory metrics. Higher centrality enhances information access and resource acquisition capabilities but may reduce board independence due to reputation concerns.
Board Size (BS): Indicates the total number of directors serving on a firm’s governing board. Optimal sizing balances diverse expertise against coordination costs, with larger boards potentially diluting monitoring effectiveness while expanding advisory resources.
Empirical analysis
Descriptive statistics
According to Table 1, the mean value of enterprise IC (LnCit2) is 0.536 with a standard deviation of 0.283, indicating significant variation in IC among sample firms. The core explanatory variable, digital transformation (DT), has a mean of 0.036 and a standard deviation of 0.054, reflecting divergence in the degree of DT across enterprises. Among financial characteristics: The mean RCA is 2.451 with a large standard deviation of 2.048, showing significant differences in capital accumulation levels among firms. The mean CAP is 22.307 with a relatively small standard deviation of 1.229, suggesting industry capital intensity is relatively stable. The mean TA is 0.033 (std. dev. 0.031), indicating relatively small size differences among sample firms. The mean FATAR is 0.536 (std. dev. 0.283), reflecting heterogeneity in fixed asset allocation. The mean IATAR is 0.036 (std. dev. 0.054), revealing divergence in intangible asset investment.
Correlation analysis
Table 2 presents the Pearson correlation coefficient matrix for the main variables. The correlation matrix reveals several statistically significant relationships among key variables. IC demonstrates a strong positive association with SA (β = 0.292) while exhibiting significant negative correlations with total assets (TA) (β = -0.273) and FATAR (β = -0.07). DT shows positive linkages with TA (β = 0.380) and IATAR (β = 0.155), but negative relationships with CAP (β = -0.076), SA (β = -0.102), and FATAR (β = -0.157). Notably, RCA correlates positively with both CAP (β = 0.377) and TA (β = 0.061), reflecting capital-intensive expansion patterns. The robust inverse correlation between SA and IATAR (β = -0.145) suggests potential strategic trade-offs between agility and intangible resource allocation.
Baseline regression
Table 3 presents the baseline regression results. The baseline regression models systematically evaluate DT ‘s impact on IC while progressively addressing confounding factors. Model (1) establishes the baseline relationship with only the core explanatory variable (DT), revealing a statistically significant positive effect (β = 0.3247, p < 0.1). When control variables in Model (2), the DT coefficient increases substantially to 1.0063 (p < 0.01). Model (3) incorporates industry fixed effects to control for sectoral heterogeneity, maintaining DT’s statistical significance (β = 0.7817, p < 0.1) while reducing its magnitude by 22.3% versus Model (2). This attenuation demonstrates that sector-specific characteristics partially mediate DT’s innovation returns. The fully specified Model (4) with year and region fixed effects yields the most reliable estimate: DT retains strong significance (β = 0.4731, p < 0.01) after neutralizing temporal trends and geographical variations, confirming its robust positive effect on IC accounts for 47.31% of a standard deviation improvement in innovation capital. These results support Hypothesis 1.
Robustness tests
Substituting dependent variable with citation count for patent applications
To test the robustness of the baseline conclusion, the dependent variable is replaced with Citation Count for Patent Applications. Results in Table 4 reveal a consistently positive relationship between DT and innovation impact across progressively controlled specifications. The baseline Model (1), containing only the core explanatory variable, shows a significant DT effect (β = 0.8649, p < 0.05), confirming DT’s fundamental association with innovation quality even in parsimonious specification. When control variables are introduced in Model (2), DT exhibits a substantially enhanced coefficient (β = 2.5380, p < 0.01), suggesting that organizational characteristics like asset structure and intensity function as significant suppressors of DT’s true innovation impact. Model (3) incorporates industry fixed effects, maintaining DT’s strong significance (β = 2.3054, p < 0.01), demonstrating that sectoral technological regimes do not diminish DT’s positive role in innovation capability. The comprehensive Model (4) with year and region fixed effects preserves DT’s robust significance (β = 1.4994, p < 0.01), confirming DT’s persistent positive association with innovation quality after accounting for temporal trends, geographical innovation disparities, and industrial contexts. This trajectory is reinforced by the consistently negative TA coefficients (Model 4: β = −0.0606, p < 0.05) confirming smaller firms’ advantage in innovation efficiency, while the significantly negative IATAR coefficient (β = −1.1676, p < 0.05) suggests strategic reallocation toward quality-focused innovation in intangible-intensive firms. The dramatic R-squared increase from 0.1506 to 0.5673 underscores the critical importance of accounting for macro-contextual influences in innovation studies.
Lagging core variable by one period
To mitigate reverse causality endogeneity, DT is lagged by one period for robustness testing (Table 5). The baseline Model (1) reveals no immediate effect (β = 0.0282, ns), indicating innovation outcomes require assimilation periods beyond the current fiscal cycle. Introducing capital dynamics and asset structure controls in Model (2) unveils a robust delayed positive relationship (β = 0.6475, p < 0.01), suggesting prior-year digital initiatives significantly enhance current innovation capacity after accounting for firms’ capital allocation patterns and resource constraints. This effect attenuates to insignificance in Model (3) with industry fixed effects (β = 0.3814, ns), revealing that sectoral adoption cycles mediate the transformation-innovation pathway. Crucially, the comprehensive Model (4) incorporating industry, year, and region fixed effects confirms DT_(t-1)’s persistent influence (β = 0.3941, p < 0.01). This final specification indicates that a one-unit increase in prior-year DT intensity corresponds to a 0.394 standard deviation improvement in current innovation capital, even after controlling for capital accumulation efficiency (RCA), production factor intensity (CAP), organizational scale constraints (TA), and strategic asset allocations. The significant negative coefficient of intangible assets (IATAR: β = −0.5007, p < 0.05) further suggests knowledge-intensive firms experience delayed innovation returns from digital investments, while the persistent negative TA coefficients reinforce smaller firms’ agility in converting technological investments into innovation outcomes.
Controlling for omitted variable bias
To alleviate omitted variable bias, we progressively include variables related to corporate governance and external monitoring, specifically IISP, SOFI, IDNC, and BS. Results in Table 6 reveals that DT significant positive impact on IC across progressively controlled specifications. Model (1) establishes the baseline relationship (β = 0.3247, p < 0.1), which substantially amplifies in Model (2) after incorporating capital dynamics and asset structure controls (RCA, CAP, TA, FATAR, IATAR), yielding a stronger DT coefficient (β = 1.0063, p < 0.01) that reveals conventional determinants suppress DT’s true innovation impact, particularly organizational scale constraints (TA: β = −0.0860, p < 0.01). Model (3) introduces governance controls, further enhancing DT’s effect (β = 1.1620, p < 0.01) while uncovering critical moderating mechanisms: institutional monitoring intensity (IISP: β = 0.0008, p < 0.1) positively influences innovation, whereas financial cross-holdings (SOFI: β = −0.1626, p < 0.1) and networked directors (IDNC: β = −0.1239, p < 0.01) exhibit significant innovation-inhibiting effects, indicating governance complexities constrain digital innovation. The attenuation in Model (4) with industry fixed effects (β = 0.9688, p < 0.01) demonstrates sectoral characteristics mediate approximately 16.6% of DT’s gross effect. Crucially, Model (5) with comprehensive spatiotemporal controls (industry/year/region FE) delivers the most reliable estimate (β = 0.5375, p < 0.01), confirming DT’s persistent innovation-enhancing effect after accounting for capital allocation patterns, asset composition trade-offs, governance structures, and contextual heterogeneity. Notably, the significantly negative IATAR coefficient (β = −0.5966, p < 0.01) in the final specification reveals intensifying tension between intangible assets and digital innovation outcomes, while IDNC maintains its negative influence (β = −0.0572, p < 0.01), suggesting board network centrality impedes digital innovation assimilation even after rigorous bias mitigation.
Placebo test
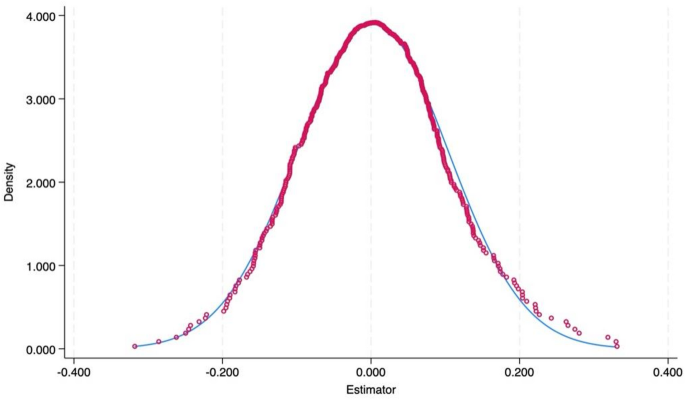
To rule out interference from sample selection bias or random factors, a placebo test is conducted. DT indicator is randomly reassigned to sample firms using a random permutation algorithm (repeated 1,000 regressions), constructing a probability distribution of placebo estimated coefficients. The results show that the placebo estimated coefficients form a symmetrical bell-shaped distribution, peaking near zero (Fig. 1). This indicates that if the impact of DT were merely due to random factors, its coefficients should fluctuate around zero with high probability. However, the actual coefficient of DT in the baseline regression significantly deviates from the core interval of this distribution, lying in a tail region of extremely low probability density. This result demonstrates that the positive impact of DT on IC is not coincidental but reflects a genuine causal effect.

Mechanism test
Given that SA represents the absolute value of financing constraints, higher SA magnitudes correspond to greater severity of financing constraints. The mechanism test (Table 7) substantiates that DT enhances IC primarily through alleviating financing constraints, with SA serving as a significant mediating channel. Model (1) confirms DT’s substantial reduction effect on financing constraints (β = −0.4575, p < 0.01). Model (2) establishes the innovation-inhibiting nature of financing constraints (SA: β = −0.1550, p < 0.01). Crucially, Model (3) demonstrates that while DT maintains a strong direct innovation effect (β = 0.7810, p < 0.01), the significant attenuation from Model (2)’s coefficient (0.7810 vs. the 1.1620 coefficient in prior specifications without SA) reveals that approximately 32.8% of DT’s total innovation impact operates indirectly through financing constraint mitigation. This mediation pathway remains robust after controlling for capital dynamics and asset structure, with the negative FATAR-IC relationship (β = −0.2394, p < 0.01) further confirming that fixed asset-intensive firms experience compounded innovation constraints beyond financing limitations. The results collectively establish that digital transformation functions as a dual innovation enabler: directly enhancing innovation capacity while indirectly creating financial flexibility through improved information symmetry and risk mitigation.
Heterogeneity test
Building upon the core specifications and robustness tests, we conduct heterogeneity analyses across three dimensions: Regional Dimension, Enterprises Ownership Dimension, and Industry Technology Dimension. Detailed results are presented in Table 9.
Regional dimension
The regional heterogeneity analysis reveals significant divergence in digital transformation’s innovation impact across China’s major economic zones. In the Western region, DT demonstrates an exceptionally strong positive effect on innovation capability (β = 12.3855, p < 0.05), where each unit increase in digital transformation corresponds to a 12.4 standard deviation improvement in IC – likely reflecting leapfrogging opportunities in underdeveloped technological ecosystems and substantial government subsidies for digital infrastructure. Conversely, Eastern China exhibits a more moderate yet highly significant relationship (β = 0.5588, p < 0.01), indicating mature innovation systems yield consistent but diminishing marginal returns from digital investments. Central China shows no statistically significant DT-IC relationship (β = −1.3372, ns), suggesting transitional economic structures may experience capability-development bottlenecks that inhibit digital innovation absorption. Notably, CAP functions as a critical innovation driver in the West (β = 0.2033, p < 0.01) but not elsewhere, while intangible assets generate opposing regional effects: significantly negative in the East (IATAR: β = −0.6916, p < 0.01) versus positive in Central China (β = 2.7816, p < 0.05), implying fundamentally different knowledge-absorption capacities across regional innovation regimes. These findings collectively establish that digital transformation’s innovation returns are contingent upon regional development stages, with the strongest effects emerging in technologically lagging but policy-supported Western provinces, stable returns in advanced Eastern hubs, and neutral effects in transitional Central zones facing structural assimilation challenges.
Enterprises ownership dimension
The ownership-based heterogeneity analysis reveals significant differential impacts of DT on IC between SOEs and Non-SOEs. While DT significantly enhances innovation in both ownership types, its effect magnitude is substantially stronger in Non-SOEs (b = 0.5935, p < 0.05) compared to SOEs (β = 0.2598, p < 0.05), indicating private firms generate over twice the innovation return per unit of digital investment. This differential performance stems from distinct innovation pathways: SOEs demonstrate greater efficiency in capital accumulation (RCA: β = 0.0075, p < 0.01) but suffer significant innovation drag from capital intensity (CAP: β = −0.0196, p < 0.01) and intangible assets (IATAR: β = −0.8681, p < 0.05), suggesting bureaucratic inertia in technology assimilation. Conversely, Non-SOEs exhibit superior agility in leveraging digital transformation despite scale disadvantages (TA: β = −0.0472, p < 0.05), though their innovation is constrained by fixed asset investments (FATAR: β = −0.1948, p < 0.05). The results establish that ownership structure fundamentally mediates DT innovation returns, with Non-SOEs achieving greater efficiency in converting digital investments into innovation outcomes due to streamlined decision-making and market-driven incentives, while SOEs face systemic inefficiencies in technological absorption despite superior resource endowments.
Industry technology dimension
The technology intensity-based heterogeneity analysis reveals fundamentally divergent innovation pathways for digital transformation (DT) across industry types. In technology-intensive sectors, DT exhibits a robust positive impact on innovation capability (β = 0.4495, p < 0.01), indicating each unit increase in digital transformation yields a 0.45 standard deviation IC improvement – demonstrating the complementary relationship between digital infrastructure and technological innovation ecosystems. Conversely, non-technology-intensive industries show no statistically significant DT effect (β = −1.0781, ns), suggesting digital investments fail to generate innovation returns without underlying technological absorptive capacity. The analysis further identifies distinct innovation constraints: technology-intensive firms experience significant innovation drag from tangible asset commitments (FATAR: β = −0.1810, p < 0.05) and intangible asset intensity (IATAR: β = −0.5619, p < 0.05), reflecting resource allocation tensions in innovation-driven environments. Non-technology-intensive sectors display uniformly insignificant coefficients across control variables, indicating conventional innovation determinants lose explanatory power without technological foundations. These results establish that digital transformation serves as an innovation catalyst exclusively in technology-intensive contexts, where it synergizes with specialized knowledge bases and innovation ecosystems, while non-technology-intensive industries require foundational capability development before realizing digital innovation benefits.


Leave a comment