
When Sentiment Breaks Down, Physical Markets Reveal Their True Purpose
There is a recurring pattern in precious metals markets that plays out with remarkable consistency across cycles: the moment paper-market participants capitulate en masse, physical buyers from the world’s largest consuming nations accelerate their accumulation. Understanding why this divergence exists, and what it ultimately means for price direction, is the analytical lens that separates reactive investing from strategic positioning.
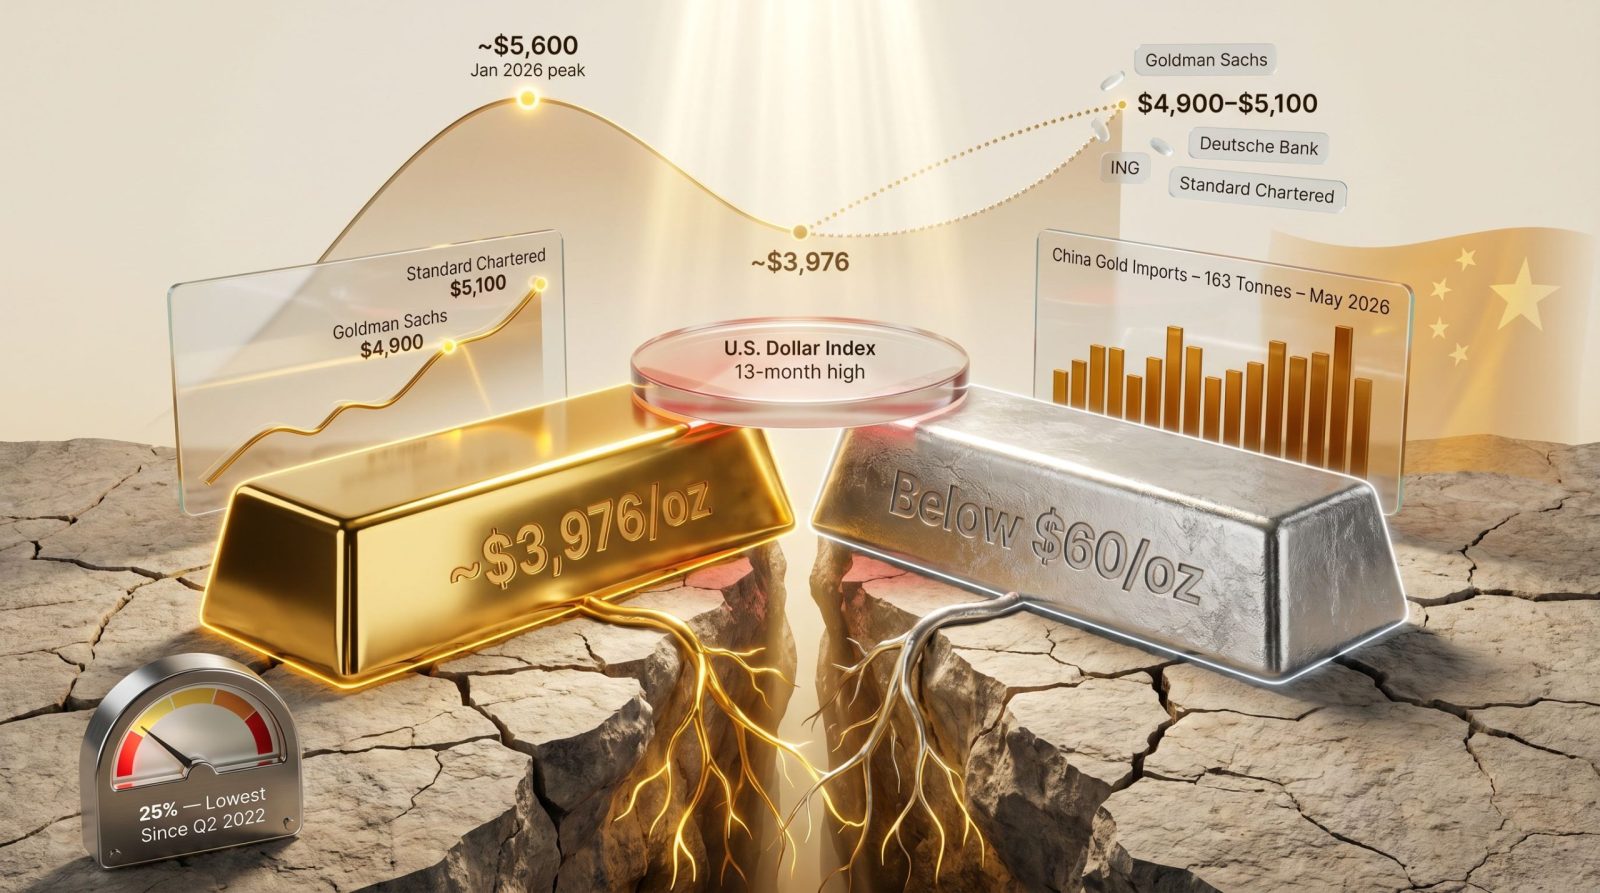
June 2026 delivered precisely this kind of setup. With gold below $4,000 and silver below $60 for the first time in months, the headline narrative pointed to a metals breakdown. Beneath the surface, however, the data told a fundamentally different story.
When big ASX news breaks, our subscribers know first
The Mechanics Behind the June 2026 Selloff
How Federal Reserve Repricing Transmits Into Metal Prices
The catalyst for the late-June decline was not a change in gold’s fundamental demand picture. It was a rapid and dramatic repricing of Federal Reserve policy expectations within a single trading week.
According to CME FedWatch data, the probability of a September 2026 rate hike surged from approximately 29% to 70% in less than seven days. Fed Chair Warsh reinforced a price-stability mandate publicly, while Governor Waller explicitly ruled out near-term rate reductions. The mechanical consequences followed a familiar sequence:
- Hawkish Fed signals strengthened the U.S. Dollar Index to a 13-month high
- A stronger dollar raises the effective cost of gold for buyers transacting in non-USD currencies
- Rising real yield expectations increase the opportunity cost of holding zero-yield assets like gold and silver
- Institutional traders reduced long futures positions, amplifying spot price declines
- Algorithmic selling accelerated once key psychological levels were breached, specifically $4,000 for gold and $60 for silver
Gold dropped below $4,100 in a single session, touching levels not seen since November 2025, falling more than $120. Silver’s decline was steeper, exceeding 5% in a single day and breaking below $60 for the first time since December 2025.
Why Silver Fell Harder: Understanding the Dual-Identity Problem
Silver’s dual role as both a monetary hedge and an industrial commodity creates higher beta exposure to macro sentiment shifts, which explains its amplified decline relative to gold. During risk-off episodes driven by monetary tightening concerns, silver typically magnifies gold’s directional move.
The gold-silver ratio widening during this episode is consistent with historical Fed tightening cycle patterns and reflects financial stress rather than a fundamental reassessment of silver’s industrial demand.
“Silver’s higher volatility is a feature of its market structure, not a flaw. In recovery phases following Fed tightening cycles, silver has historically outpaced gold on the upside for precisely the same reason it falls harder on the way down.”
Bank of America had already flagged the possibility of three rate hikes in 2026 before this episode, a scenario that silver’s futures market began pricing into its decline well ahead of confirmation.
Price Benchmarks at a Glance
| Metric | Level (Late June 2026) | Prior Reference | Change |
|---|---|---|---|
| Gold Spot Price | ~$3,976/oz | $4,000+ (Nov 2025 floor) | ~3% single session |
| Silver Spot Price | Below $60/oz | $60+ (Dec 2025 floor) | 5%+ single session |
| Gold vs. Jan 2026 High | ~$3,976 | ~$5,600 (Jan 2026 peak) | ~29% below peak |
| Silver vs. 2026 Peak | Below $60 | ~$122 (2026 peak) | 50%+ below peak |
| U.S. Dollar Index | 13-month high | Prior multi-month range | Multi-month breakout |
| September Rate Hike Probability | ~70% | ~29% (one week prior) | +41 percentage points |
China’s Physical Demand: The Counter-Narrative the Paper Markets Ignore
Import Volumes Reached a Two-Year High Precisely When Prices Fell
While futures markets processed hawkish Fed signals, China’s customs data for May 2026 showed the country imported approximately 163 tonnes of gold, the highest monthly figure since March 2024, according to Bloomberg and Mining.com. Total Chinese gold imports for the first five months of 2026 reached approximately 692 tonnes, representing a 76% increase year-over-year.
Furthermore, the People’s Bank of China simultaneously extended its consecutive monthly buying streak to 19 months in May, adding nearly 10 tonnes in that month alone — its largest single-month purchase since December 2024, according to World Gold Council data. This sustained central bank demand continues to underpin the market’s structural foundation.
“Chinese sovereign and retail buyers are accumulating physical gold at prices 25 to 30% below January 2026’s all-time high. This is not momentum-driven behaviour responding to price signals. It reflects a multi-year reserve diversification mandate that operates independently of short-term paper market fluctuations.”
Physical bullion bars and gold accumulation products are the primary vehicles driving this demand. The depth and consistency of Chinese buying establishes a structural demand floor that paper market liquidation cannot easily displace.
Physical vs. Paper Market Divergence: A Structural Framework
| Demand Category | Current Direction | Time Horizon |
|---|---|---|
| Futures/Paper Positioning | Reducing longs, adding shorts | Short-term (weeks) |
| Gold ETF Flows | Returning to net inflows | Medium-term (months) |
| Central Bank Buying | Sustained accumulation | Long-term (years) |
| Chinese Physical Imports | Near two-year highs | Structural (multi-year) |
ETF Inflows Reverse: What Institutional Re-Entry Signals
Physical gold-backed ETFs recorded inflows of approximately $1.1 billion (5.1 tonnes) in the week ending mid-June 2026, the strongest weekly inflow since mid-April, according to World Gold Council data. This reversed four consecutive weeks of outflows that had removed approximately $7.6 billion and 58.2 tonnes from global ETF vaults.
Total global gold ETF holdings now stand at approximately 4,086.3 tonnes, with cumulative 2026 inflows remaining approximately $17 billion in positive territory despite the correction. Gold’s safe-haven demand remains structurally intact, as evidenced by the speed of this institutional re-entry.
When institutions return to a market during a price decline rather than after a recovery, it typically indicates perceived value accumulation rather than defensive repositioning. The $3,976 to $4,000 range appears to represent an institutional entry zone rather than a breakdown level.
A critical near-term variable remains the PCE inflation print. A softer-than-expected reading could accelerate the ETF inflow trend by reducing the probability weighting of multiple rate hikes.
What Major Bank Forecasts Say About the Medium-Term Outlook
Institutional Targets Remain Firmly Bullish
Despite ING revising its near-term forecasts downward — now projecting $4,300 in Q3 and $4,600 in Q4, reduced from $4,850 and $5,000 — every major institutional bank tracked maintains a bullish year-end or medium-term gold price outlook, according to Bloomberg and ForexLive data.
| Institution | Target | Timeframe |
|---|---|---|
| Standard Chartered | $5,100/oz | Mid-2027 |
| Goldman Sachs | $4,900/oz | Year-end 2026 |
| Deutsche Bank | $4,800/oz | Q4 2026 |
| ING | $4,600/oz | Q4 2026 |
At approximately $3,976/oz, Standard Chartered’s mid-2027 target represents roughly 28% upside from current levels. Goldman Sachs targets approximately 23% upside by year-end alone.
Three Structural Pillars Supporting the Institutional Consensus
Standard Chartered’s half-year 2026 outlook identifies three core forces underpinning gold’s longer-term trajectory:
- Sustained central bank gold buying across sovereign reserve managers globally, with the PBoC’s 19-month consecutive buying streak as the most visible example
- Persistent fiscal imbalances in major economies, particularly the United States, which maintain the long-term currency debasement thesis that underpins gold’s monetary premium
- Western institutional demand recovery as real yields stabilise, with ETF inflows serving as the leading indicator of this re-engagement
Key pivot points for the second half of 2026 include the trajectory of energy prices and their inflationary feedback loop, central bank policy sequencing across the Fed, ECB, and PBoC, and the pace at which investor positioning shifts as rate hike cycles approach their terminal phase.
The next major ASX story will hit our subscribers first
Investor Sentiment: Reading Pessimism as a Contrarian Signal
Confidence at a Multi-Year Low
According to Allianz Life’s Q2 2026 Quarterly Market Perceptions Study, only 25% of Americans believe the current environment is a good time to invest — the lowest reading since Q2 2022, down from 34% the prior quarter. Recession concerns and elevated market volatility are the primary drivers. Approximately half of surveyed investors have already rotated into bonds and cash as defensive positioning.
“Extreme retail pessimism readings of this magnitude historically coincide with the later stages of correction cycles, not the inception of new structural downtrends. The Q2 2022 sentiment low cited in the Allianz data preceded a significant gold price recovery phase.”
Physical metal holders are structurally insulated from sentiment-driven selling pressure because their holding rationale is independent of financial market confidence. The monetary hedge function of gold is most relevant precisely when investor confidence in financial systems is at cyclical lows.
Scenario Modelling: Three Paths for Gold and Silver in H2 2026
Scenario A: Fed Pauses, Dollar Retreats (Bull Case)
- Trigger: PCE data softens; Fed signals a pause in tightening
- Gold response: Rapid recovery above $4,200 to $4,300; silver reclaims $65+
- Alignment: Consistent with ING’s $4,300 Q3 target and Goldman’s $4,900 year-end forecast
Scenario B: One Hike Delivered, Then Pause (Base Case)
- Trigger: September hike proceeds; Fed signals terminal rate reached
- Gold response: Consolidation in $3,900 to $4,200 range before resuming uptrend in Q4
- Alignment: Consistent with Deutsche Bank’s $4,800 Q4 target; supported by current 70% CME FedWatch pricing
Scenario C: Multiple Hikes, Sustained Dollar Strength (Bear Case)
- Trigger: Inflation re-accelerates; Bank of America’s three-hike scenario materialises
- Gold response: Extended consolidation; potential test of $4,000 support levels and below, with possible extension to the $3,700 to $3,800 range
- Structural floor: Central bank buying and Chinese physical demand provide demand support even under this scenario
Key Indicators to Monitor for Gold and Silver Direction
| Indicator | Bullish for Gold If… | Bearish for Gold If… |
|---|---|---|
| PCE Inflation Print | Comes in below expectations | Surprises to the upside |
| Fed Communications | Signals pause or pivot | Confirms multiple hike path |
| U.S. Dollar Index | Reverses from 13-month high | Continues strengthening |
| Chinese Import Data | Remains above 150 tonnes monthly | Falls sharply |
| Gold ETF Weekly Flows | Sustains positive inflows | Returns to net outflows |
| Central Bank Purchases | PBoC streak extends beyond 19 months | Sovereign buying pauses |
The Longer-Term Architecture: Why the Structural Case Remains Intact
The divergence between paper market pricing and physical demand during episodes like gold below $4,000 and silver below $60 is not a new phenomenon. It is, in fact, a recurring feature of precious metals bull markets. Futures markets respond to monetary policy signals in days or weeks. Central banks, sovereign wealth managers, and large-scale physical accumulation programs operate on timelines measured in years and decades.
Three forces define the long-term demand architecture that persists regardless of near-term price action:
- Sovereign reserve diversification is a multi-decade structural shift, with central banks globally reducing USD concentration and increasing hard asset allocations as a deliberate long-term strategy
- Fiscal deficit monetisation risk across major economies sustains the debasement thesis that provides gold’s monetary premium over paper currencies
- Western institutional re-engagement remains a cyclical force that activates as rate hike cycles approach their terminal phase, with ETF flow data serving as the most reliable leading indicator
The episode of gold below $4,000 and silver below $60 in June 2026 was driven by a specific, identifiable catalyst: a rapid repricing of Fed rate expectations. Every prior pullback in this cycle followed a similar pattern and resolved in the same direction. The physical demand data, institutional bank forecasts, and ETF inflow reversal collectively indicate this episode is a cyclical correction within a longer-term structural bull market rather than a trend reversal.
Disclaimer: This article is for informational and educational purposes only and does not constitute financial or investment advice. All price forecasts, scenario projections, and analyst targets cited are sourced from publicly available institutional research and are subject to change. Past performance is not indicative of future results. Investors should conduct their own due diligence and consult a qualified financial adviser before making any investment decisions. Precious metals investing involves risk and may result in partial or total loss of capital.
Want to Know Which ASX Mineral Discoveries Could Deliver the Next Big Return?
When structural bull markets create short-term volatility, identifying the right opportunities before the broader market catches on becomes critical — and Discovery Alert’s proprietary Discovery IQ model does exactly that, delivering real-time alerts on significant ASX mineral discoveries and turning complex data across 30+ commodities into clear, actionable insights. Explore historic examples of major discovery returns to understand what’s possible, then begin your 14-day free trial at Discovery Alert to position yourself ahead of the market.


Leave a comment