

Analysis of the impact mechanism
The above research shows that tax reduction can significantly promote enterprise innovation activities. However, the above analysis focuses only on the overall effect of tax reduction on corporate R&D investment and innovation output. The following text will further study the mechanism by which tax reduction promotes enterprise R&D input and innovation output. Intermediary effect analysis is an important step to test whether a variable is an intermediate variable and to what extent. Baron and Kenny (1986) provided a seminal and widely employed mediation model in the social sciences designed to determine and validate the extent to which an independent variable affects a given outcome variable through a mediator. This method hinges on a series of stepwise regression analyses, each aimed at establishing a specific condition for the mediation analysis, this paper uses stepwise test regression coefficient method to study the internal mechanism of tax reduction’s influence on enterprise innovation:
$$M_{i,t} = \beta _0 + \beta _1Incentive_{i,t} + {\sum}\, {\gamma CV_{i,t} + \eta _i + \omega _t + \varepsilon _{i,t}}$$
(4)
$$Innovation_{i,t} = \theta _0 + \theta _1M_{i,t} + \theta _2Incentive_{i,t} + {\sum}\, {\gamma CV_{i,t} + \eta _i + \omega _t + \varepsilon _{i,t}}$$
(5)
where M is the mechanism variable to measure the financing effect, specialized division effect, and added value effect of enterprises. Initially, Model (2) evaluates the “total effect” of the independent variable on the dependent variable. This first step in establishing a mediation effect seeks to demonstrate a significant relationship between the independent and dependent variables. Subsequently, Model (5) indirectly assesses the significance of the product of coefficients by sequentially testing coefficients α1 and β1, which aims to ascertain the establishment of mediation. Lastly, Model (6) is employed to discern whether the mediation by the mediator is complete or partial. When both the mediator and independent variable are included in the regression model, if the influence of the independent variable becomes non-significant or diminishes, it indicates complete mediation. If the effect of the independent variable remains significant but is reduced, it indicates partial mediation.
Financing effect test
Maintaining the daily production and operational activities of an enterprise requires a sufficient cash flow, which serves as the fundamental condition. However, due to the presence of information asymmetry in the financial market, financing constraints impede the R&D activities of enterprises. When confronted with such constraints, enterprises encounter greater difficulties in accessing debt financing and equity financing, leading to increased financing costs. As a result, they tend to rely on internal financing channels. Nevertheless, given the substantial investment required for innovation, enterprises often find themselves unable to rely solely on internal cash flow to meet the demand for innovation funds, ultimately leading them to abandon innovation pursuits. In this regard, we argue that tax reduction can effectively address the aforementioned issues and promote innovation. The specific impact pathway is illustrated in Fig. 1.
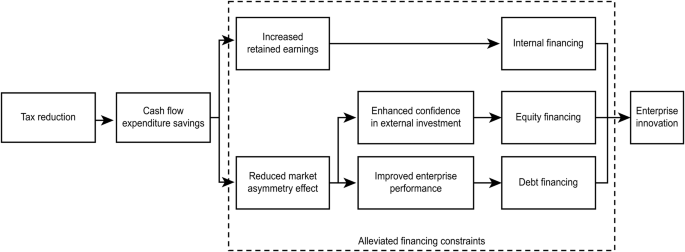
It illustrates that the financing effect of tax cuts can indeed influence corporate innovation which is realized through internal financing, equity financing, and debt financing channels.
Therefore, this paper chooses financing constraints (Cfs) as an intermediate channel to test the relationship between tax reduction and innovation level. The KZ index, SA index, and WW index are commonly used to measure enterprise financing constraints in the existing literature. This paper uses the method of Hadlock and Pierce (2010) for reference and uses the SA index to calculate the financing constraints of enterprises, as shown in Eq. (6). The larger the SA index is, the greater the financial constraints of enterprises.
$$Cfs_{it} = – 0.737 \times Size + 0.043 \times Size^2 – 0.040 \times Age$$
(6)
where Size is the natural logarithm of the total assets of the enterprise and Age is the registration period of the enterprise.
Table 6 presents the regression results of Eqs. (4) and (5), depicting the relationship between tax reduction and corporate financing constraints. The regression result of tax reduction on corporate financing constraints is presented in (1). It reveals a significantly negative impact of tax reduction on enterprise financing constraints at the 1% level, suggesting that tax reduction effectively alleviates such constraints. Additionally, Columns (2)–(3) demonstrate the impact of corporate financing constraints on R&D investment intensity and innovation levels, exhibiting a significant negative association at the 1% level. This finding underscores that financing constraints hinder enterprises from actively participating in innovation activities. Therefore, tax reduction serves as a catalyst by mitigating enterprise financing constraints, consequently promoting the intensity of R&D investments and innovation outputs.
To further analyze the influence of different financing channels on enterprises’ innovation activities, financing constraints (Cfs) are divided into internal financing (Ifs), equity financing (Efs), and debt financing (Lfs) according to the different financing channels. Referring to the treatment methods in most studies, cash flow is used to represent internal financing, i.e., (net profit of current period + depreciation of current period)/total assets of the enterprise, in which the larger the value of ifs is, the smaller the financing constraint of the enterprise is. The proportion of equity financing change in total assets (change in the value of equity/total assets) is used to measure the equity financing channel, in which the larger the value of Efs is, the smaller the financing constraint of enterprises is. Finally, the debt financing intensity is calculated by using the proportion of net expenditure of enterprise interest in total assets in the current period, and the larger the value of Lfs is, the smaller the financing constraint is.
Table 7 exhibits the regression results of Eqs. (4) and (5). Columns (1) to (3) present the regression results of tax reduction and its impact on debt financing, equity financing, and internal financing, respectively. The findings indicate a significantly positive influence of tax reduction on internal financing and equity financing channels at the 1% level. This suggests that tax reduction effectively alleviates the financing constraints faced by enterprises by facilitating internal financing and equity financing. However, tax reduction does not lead to an increase in the scale of debt financing for enterprises, implying the presence of soft restraint inertia in debt financing. Columns (4) to (9) depict the impact of debt financing, equity financing, and internal financing on the intensity of R&D investment and innovation levels within enterprises. In all cases, the regression coefficients are significantly positive at the 1% or 5% levels. These results indicate that tax reduction reduces enterprise costs, enhances the level of internal free cash flow, improves the availability of equity, enhances financing capabilities, and ultimately promotes increased R&D investment and innovation output, including the introduction of new technologies.
Specialized division effect test
With increasing economic globalization, the specialized division of labor has become a form of enterprise production organization. Many enterprises have stripped noncore businesses to obtain economy-of-scale advantages, which is conducive to promoting enterprise innovation. The role of tax reduction in deepening the division of labor will be conducive to enterprise innovation. To test this mechanism, this paper introduces specialization (VAS) indicators. Referring to the practice of Devos and Li (2021), the modified value-added method is used to measure the degree of enterprise integration by the share of added value in each industry chain in sales revenue. Since integration and specialization are the two poles of enterprise production organization, the larger the VAS is, the greater the degree of enterprise integration, and the weaker the ability to specialize.
Table 8 reports the regression results of Eqs. (4) and (5). The regression result of tax reduction to a specialized division of labor is listed in column (1). The influence of tax reduction on the degree of enterprise integration is significantly negative, indicating that tax reduction can weaken the process of enterprise integration and promote the specialized division of labor. Columns (2) and (3) indicate the influence of the specialized division of labor on R&D investment intensity and innovation level. The significantly negative coefficient of VAS indicates that specialized subdivisions promote innovation. Therefore, tax reduction can play an innovative incentive role by promoting the specialized division of labor.
Added value effect test
The market pricing ability of enterprises reflects their core competitiveness. Enterprises with higher pricing power can obtain more innovative resources from the market. The strengthening effect of tax reduction on enterprise pricing ability will help improve the innovation level. To verify the existence of a markup pricing effect, this paper constructs and tests the Additionrate variable. According to the approach by De Loecker and Warzynski (2012), this paper uses the enterprise markup pricing rate to measure enterprise value-added capability. The greater the Additionrate is, the stronger the value-added capability.
Table 9 reports the regression results of Eqs. (4) and (5). The regression result of tax reduction to enterprise value-added ability is listed in column (1). The influence of tax reduction on enterprise value-added ability is significantly positive, indicating that tax reduction has an added value effect that can strengthen enterprise value-added ability. Columns (2) and (3) indicate the impact of value-added capabilities on enterprise innovation. The significantly positive coefficient of Additionrate shows that strong value-added capability can help promote innovation. Therefore, the added value effect of tax reduction helps improve enterprise innovation levels.
Financing effect formation mechanism
Financing constraints are an important obstacle to innovation in transitional economies and are also a long-term focus of government departments. Since September 2021, China has continuously emphasized the importance of small and medium-sized enterprises in solving the difficulties posed by enterprise financing difficulties and expensive financing and relieving the pressure of enterprise operations. Previous research has shown that tax reduction can promote enterprise innovation by alleviating financing constraints. At present, although the literature has recognized this mechanism, no strong driving relationship has been shown between sufficient cash flow and the necessity of innovation.
To further elucidate the formational path of the financing effect, this study conducts an empirical examination of heterogeneity among manufacturing enterprises. Utilizing the Classification of High-tech Industries (Manufacturing) (2017) issued by the National Bureau of Statistics, the listed manufacturing enterprises are divided into high-tech manufacturing enterprises and low-tech manufacturing enterprises for subsample analysis. The results are presented in Table 10. Columns (1) to (3) depict the financing effects of tax reduction on high-tech manufacturing enterprises, while columns (4) to (6) depict the financing effects on low-tech manufacturing industries. The regression outcomes demonstrate that tax reduction has a positive effect on alleviating financing constraints for both high- and low-tech manufacturing enterprises. However, the impact is more pronounced for high-tech manufacturing enterprises. Nevertheless, concerning the influence of financing constraints on the direction of enterprise investment, the alleviation of financing constraints solely promotes R&D investment and innovation levels within high-tech manufacturing enterprises. In contrast, the impact on innovation in low-tech manufacturing enterprises lacks statistical significance. These findings suggest that the establishment of a financing effect necessitates certain conditions to be met.
The above tests indicate path dependence on the financing effect of tax reduction; that is, the financing constraint mechanism only exists for high-tech enterprises. The reason is that the greater the tax reduction policy an enterprise enjoys, the higher the position of the enterprise industry or the stronger its dominant position in the market, which is beneficial to further strengthening the recognition and trust of external investors. This creates a cyclical “policy spillover” effect, thereby developing a stronger influence in the credit and equity markets and expanding financing channels. From the perspective of innovation level, tax reduction shows heterogeneity in enterprise type. This is because the innovation ability of enterprises is largely dependent on the absorption and digestibility of new technologies (Cohen and Levinthal, 1989). Although low-tech manufacturing enterprises have certain production and manufacturing foundations, innovation is mostly micro and technological in less difficult aspects such as product appearance and design. Tax reduction leads to a lower relative cost of tangible assets compared with intangible assets. Therefore, for low-tech manufacturing enterprises, it is more attractive to introduce new technology and invest fixed assets from the market to facilitate the advantage of scale economy than to invest in R&D. However, the market-oriented technology innovation services of high-tech manufacturing enterprises are based on technological innovation, so the financing effect of tax reduction plays a more significant role in promoting innovation among high-tech manufacturing enterprises.
Test of the policy effect
Against the background of the state’s strong support for enterprise technological innovation, a variety of tax incentives are used to stimulate enterprise R&D investment and promote innovation output. Different tax incentives have different effects on enterprise innovation. The same enterprise may enjoy a variety of tax incentives. Therefore, it is not only necessary to pay attention to the effect of a single policy but also to evaluate objectively the comprehensive effect of policy combinations to optimize existing policy combinations, thereby maximizing policy effectiveness and promoting enterprise innovation.
The Enterprise Income Tax Law, revised by China in 2008, defines the tax preferential mode and scope based mainly on enterprise income tax rate, plus deduction and accelerated depreciation, and integrates the original preferential tax policy to form a unified preferential tax rate. Based on the process of tax incentives, this paper divides the existing tax incentives into two categories: one is the preferential tax rate based on 15% corporate income tax rate, and the other is the preferential tax base rate based on additional deductions and accelerated depreciation. The income tax rate allows for concessions by reducing the income tax rate payable by enterprises to reduce corporate income tax costs, thereby increasing corporate profits after tax. The additional deduction policy reduces the tax payable by deducting a certain proportion of taxable income based on the actual amount. This paper selects the 15% preferential corporate income tax rate and the R&D expense super deduction tax base preferential policy as the research object. It analyzes the differences in its effect and explores whether this policy combination can produce an effect in which “1 + 1 > 2”. Further, it divides manufacturing enterprises into low- and high-tech manufacturing industries and further compares and analyzes the effects of different tax incentives on different types of enterprise innovation.
Table 11 presents the regression results of the preferential policy involving a 15% tax rate and R&D expenses plus tax reduction. Columns (1) to (6) illustrate the regression outcomes of the 15% preferential tax rate policy solely for manufacturing enterprises. M1 represents samples in Manufacturing, M2 represents samples in High-tech Manufacturing, and M3 represents samples in Low-tech Manufacturing. However, the results indicate that the impact of the 15% preferential tax rate on corporate innovation activities lacks statistical significance. Consequently, the policy has not achieved the anticipated outcomes, leaving room for further exploration. Columns (7) to (12) exhibit the regression results of the R&D expense super deduction policy exclusively for manufacturing firms. The findings reveal that the R&D expense super deduction tax base preferential approach can stimulate enterprise investment in R&D activities. Nevertheless, its impact on innovation output activities, such as technology introduction, is not statistically significant. The estimations conducted in this study reveal heterogeneous effects of existing tax incentives on corporate innovation activities. One potential explanation for this disparity is that the “one-size-fits-all” 15% preferential tax rate is exclusively applicable to individual key development industries. Once identified as “high-tech,” enterprises merely need to fulfill the pre-examination requirements to continue benefiting from the preferential tax rate, thus undermining the policy’s effectiveness. Furthermore, China’s preferential tax policies solely focus on the R&D investment stage, lacking stringent requirements for the innovation output stage. As a result, there exists a noticeable gap between the effects of this policy on enterprise innovation output and the intended expectations.
In order to investigate the combined effect of the 15% preferential tax rate and the R&D expense super deduction policy, the interaction of the 15% preferential tax rate and the R&D expense super deduction policy is introduced on the basis of a single preferential policy. If the enterprise enjoys two policies at the same time, Policy Portfolio = 1; Otherwise, it is 0. The model is further designed as follows:
$$\begin{array}{l}Innovation_{i,t} = \chi _0 + \chi _1 \times 15{{{\mathrm{\% }}}}\,preferential\,tax\,rate_{i,t} + \chi _2 \\ \times \, R\& D\,expense\,super\,deduction_{i,t} + \chi _3 \\ \times \, Policy\,Portfolio_{i,t} + {\sum}\, {\gamma CV_{i,t} + \eta _i + \omega _t + \varepsilon _{i,t}} \end{array}$$
(7)
The interaction coefficient χ3 reflects the impact of policy combination on the innovation activities of enterprises. If χ3 is less than 0, it indicates that the simultaneous implementation of the 15% preferential tax rate and the R&D expense super deduction policy will inhibit the effect of a single policy. On the contrary, if χ3 is greater than 0, it indicates that there is a complementary relationship between the policy combination. Table 12 shows the effect of the policy combination of the 15% preferential tax rate and the R&D expense super deduction policy. As shown in Table 12, the effect of this policy combination on the R&D investment level of manufacturing enterprises is significantly positive at the 1% level, indicating that the simultaneous application of the 15% preferential tax rate and the R&D expense super deduction policy can strengthen the single-policy innovation incentive effect. However, the impact of this policy combination on the innovation degree of manufacturing enterprises is not statistically significant. This result verifies the mismatch between the R&D input end and output end of enterprises, indicating that although tax reduction incentives can promote domestic manufacturing enterprises to invest considerably R&D activities, there are still structural imbalances in the transformation of results and innovation competitiveness.


Leave a comment