

have entered a short-term corrective phase inside a broader bullish structure. The 15-minute /GC chart shows price near $4,638, retreating from the recent $4,755 high and now testing the first important VC PMI support zone.
VC PMI Structure

The Daily VC PMI mean at $4,659 is the immediate equilibrium. Gold trading below this level shifts the short-term momentum toward the Daily Buy 1 at $4,621. This is the first high-probability mean-reversion zone. If selling accelerates through B1, Daily Buy 2 at $4,577 becomes the next major objective.
Importantly, the Weekly VC PMI mean at $4,589 nearly converges with Daily B2. The $4,577–$4,583 area therefore represents a major technical support cluster. A successful test and reversal from this zone could provide the foundation for another advance toward $4,653, followed by Daily Sell 1 at $4,703 and Daily Sell 2 at $4,741. Above these levels, the larger weekly objectives remain $4,788 and $4,895.
A sustained break below $4,577 would weaken the bullish configuration and expose Weekly Buy 1 at $4,476.
Cycle Dates & Square of 9

The market is approaching the August 27–September 3 cycle window, making the current decline particularly important. Rather than automatically interpreting weakness as a trend reversal, traders should watch for evidence of a cyclical low developing around the Daily B1/B2 support structure.
From a Square of 9 perspective, the recent $4,755 swing high serves as an important vibration anchor. Rotational price relationships around the $4,700, $4,650, $4,600 and $4,575 regions reinforce the significance of the current VC PMI zones. Price/time confirmation remains essential before declaring the correction complete.
Fundamentals
Gold’s immediate fundamental environment is mixed. U.S. fell to 203,000, suggesting labor-market stability, while inflation remains elevated, giving the Federal Reserve room to maintain a restrictive posture. Treasury yields were also firm Thursday ahead of Fed Chair Kevin Warsh’s remarks.
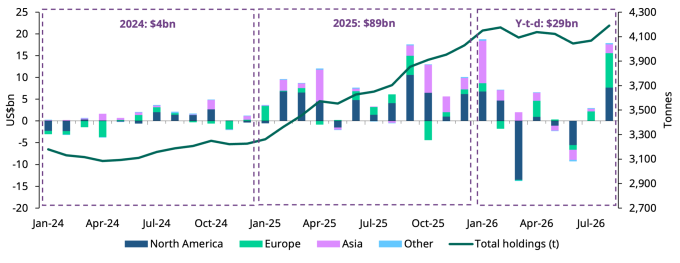
At the same time, the medium-term gold case remains supported by fiscal and currency concerns. Treasury’s expanded long-duration bond buybacks have contributed to dollar-debasement concerns, while gold-backed ETFs recently recorded their largest weekly inflow in ten months.
Outlook
The preferred strategy remains buying corrections rather than aggressively shorting a broader bullish market. Watch $4,621 first, then the powerful $4,577–$4,583 convergence zone. Recovery above $4,653 would improve the short-term outlook considerably and reopen $4,703–$4,741.
Disclosure: This analysis is educational and informational only and is not individualized investment advice. Futures and options involve substantial risk of loss and may not be suitable for all investors. VC PMI, cycle and Square of 9 projections are probability-based analytical tools; no price target, support level, cycle date, or market outcome is guaranteed.













Leave a comment