
Highlights
- Global investors ramped up gold ETF allocations in August, adding US$18bn, led by North American- and European-listed funds.
- The rallying gold price and strong inflows pushed global gold ETFs’ total AUM 16% higher m/m to US$615bn, while holdings rose 121t to a record high of 4,189t.
- Gold market activity rebounded in August, with average daily trading volumes rising 21% m/m across all major market segments.
August in review
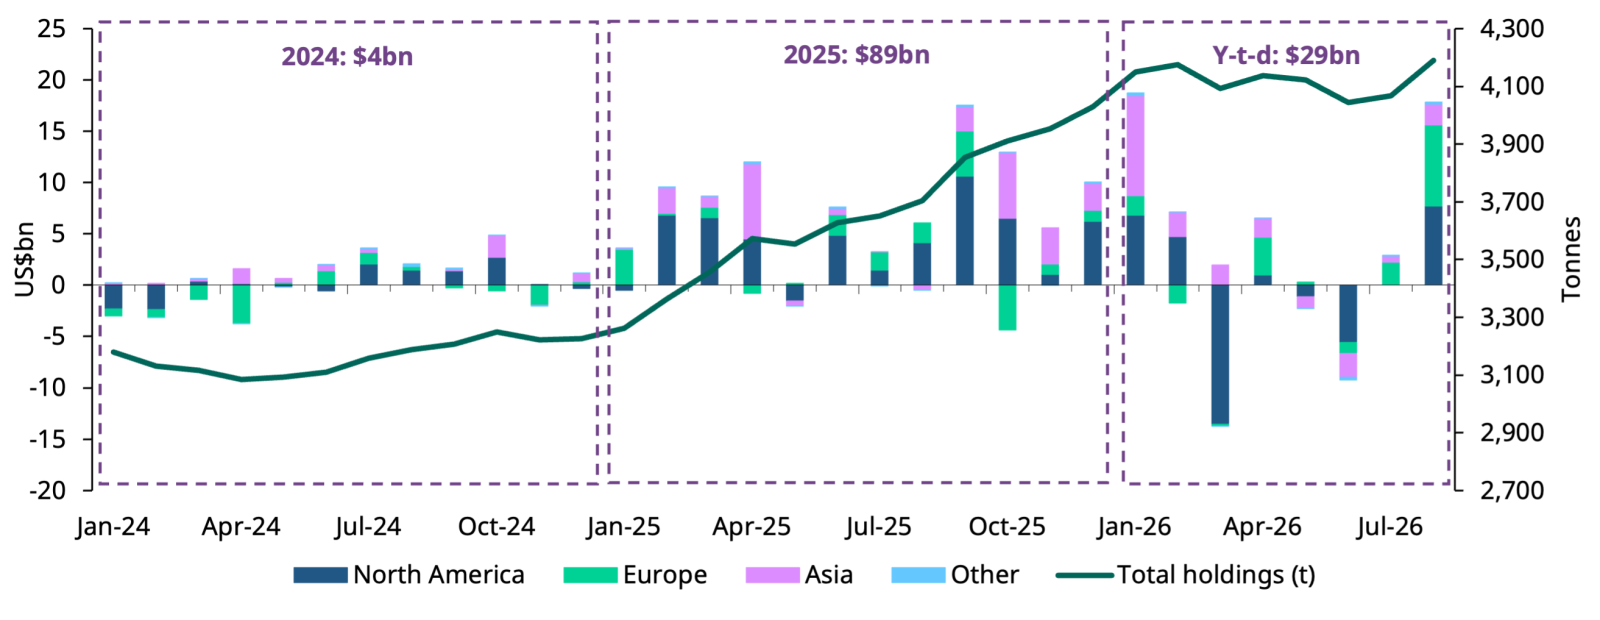
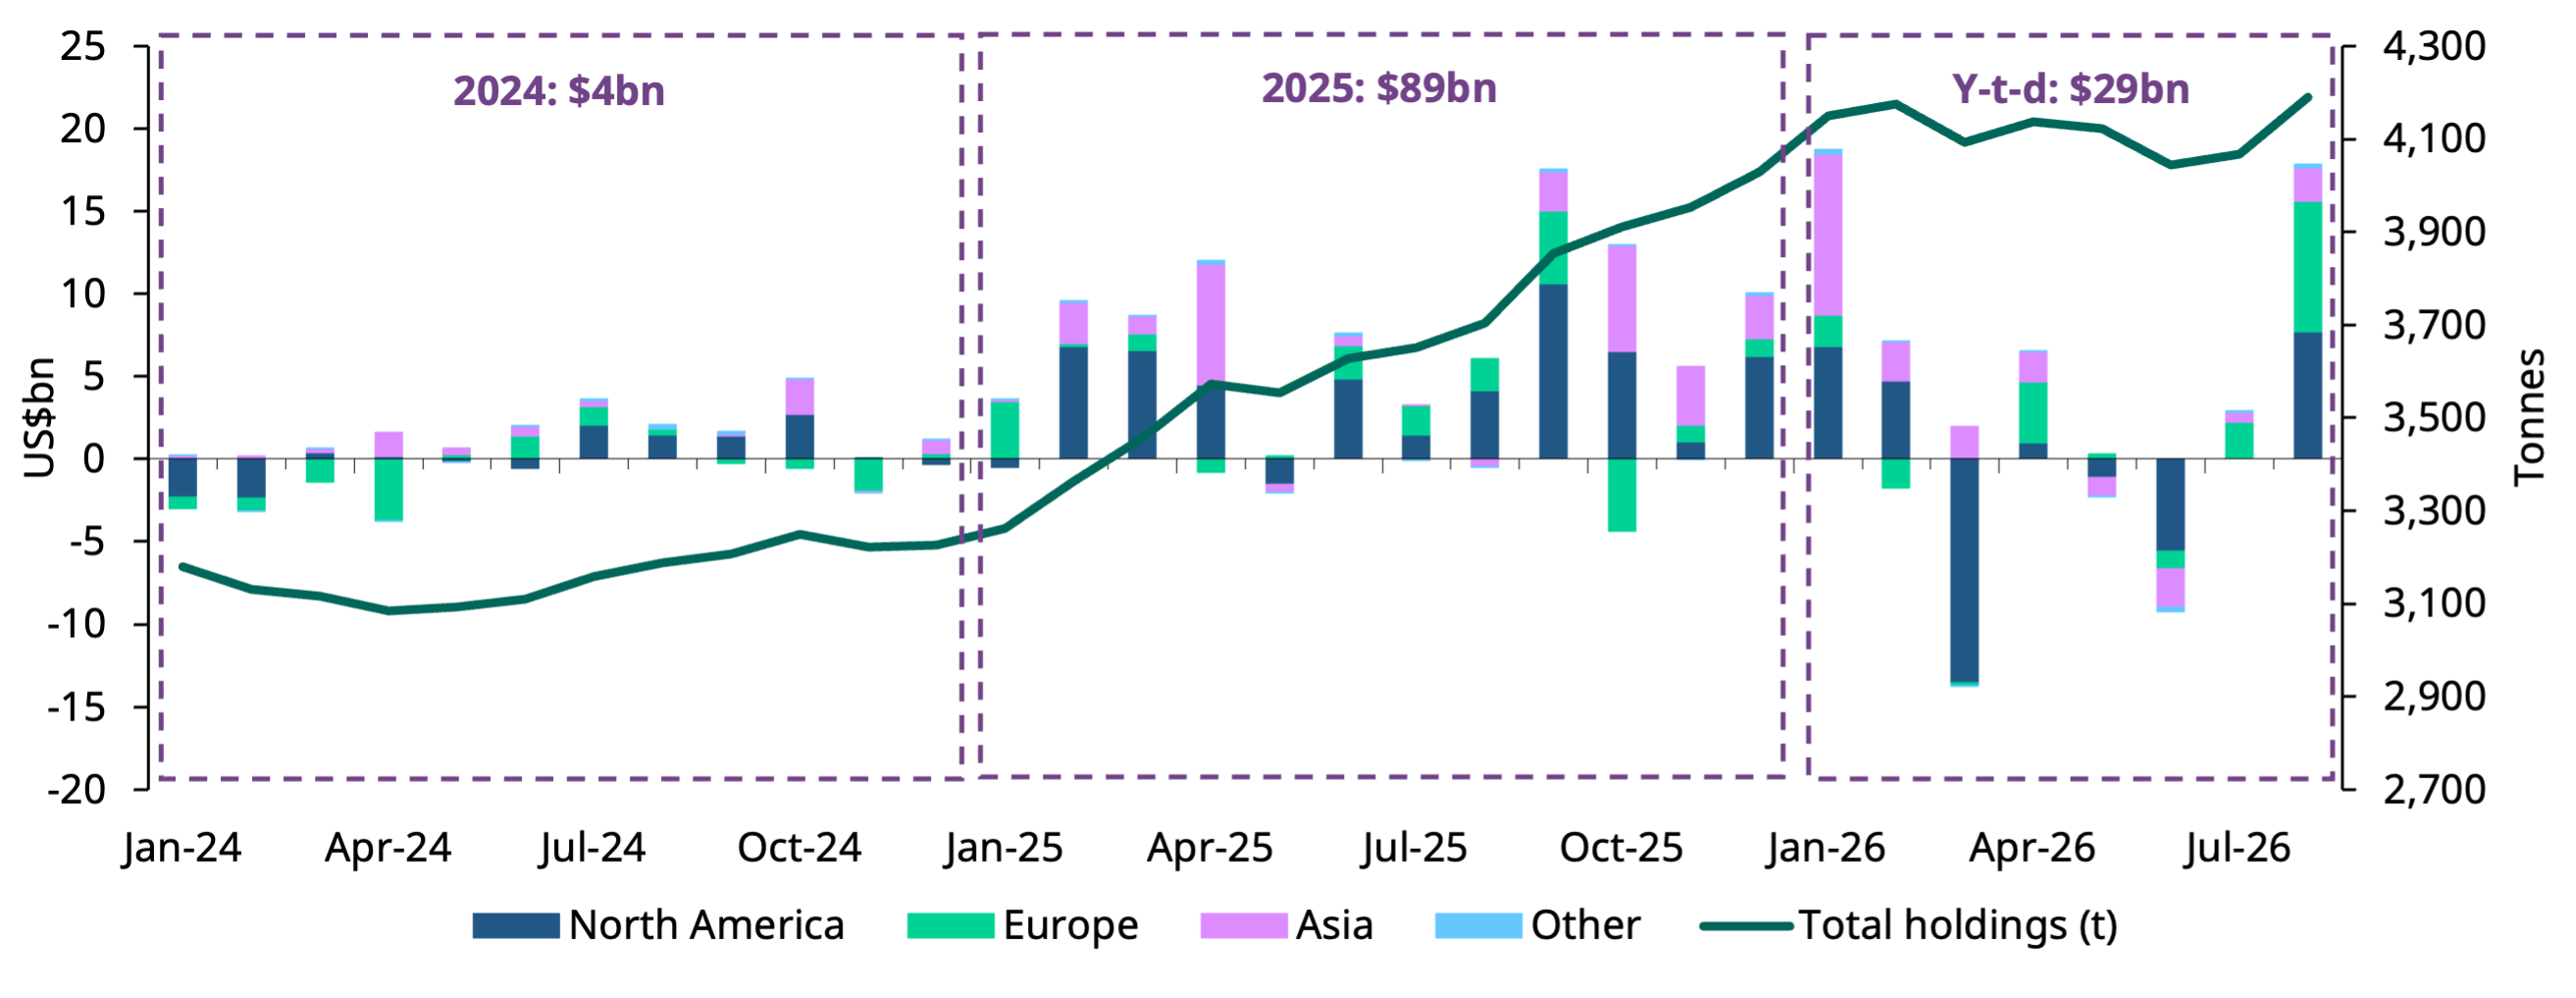
Global gold backed ETFs1 added US$18bn in August, marking the second largest monthly inflow in value terms on record (Chart 1). The surge in inflows was driven primarily by North American- and European-listed funds. North America recorded its third-largest monthly inflow on record, while Europe posted its largest. Positive flows, together with a higher gold price, lifted global gold ETF assets under management (AUM) by 16% to US$615bn. Collective holdings rose by 121t to 4,189t, the highest on record.
Y-t-d, global gold ETF inflows totalled US$29bn, equivalent to a 160t increase in holdings. Asian-listed funds remained the largest contributor to global inflows over the period, followed by Europe. North American flows turned modestly positive thanks to August’s strong performance, although the region remains the only one with negative net demand y-t-d as it continues to recover from the March drawdown.2
Chart 1: Western investors return in force, pushing holdings to record highs
Global gold ETF flows by region and collective holdings*
*As of 31 August 2026.
Source: Bloomberg, Company Filings, World Gold Council
Regional overview
Global gold ETF inflows accelerated sharply in August, likely reflecting three related developments:
- Yen intervention and FX-policy concerns: US intervention to support the yen on 31 July likely spilled into early August, fuelling concerns around broader policy intervention in currency markets3
- Fiscal and Treasury market concerns intensified: Rising long-term yields and the US Treasury’s 19 August intervention heightened concerns around fiscal sustainability and dominance, while reviving fears of potential dollar debasement4
- Momentum reinforced flows: As gold rallied and broke above key technical levels,5 price momentum likely attracted additional tactical and institutional demand.
North American funds attracted US$7.7bn in August, their third-largest monthly inflow on record. Demand was relatively modest early in the month before accelerating sharply during the week of 17 August when funds added roughly US$4bn, or more than half of the month’s total inflow, in just five trading days.
The timing of these flows appears consistent with the drivers outlined above. Importantly, August’s strong inflow helped offset the region’s record US$13bn outflow in March, bringing North American fund flows back into positive y-t-d territory.
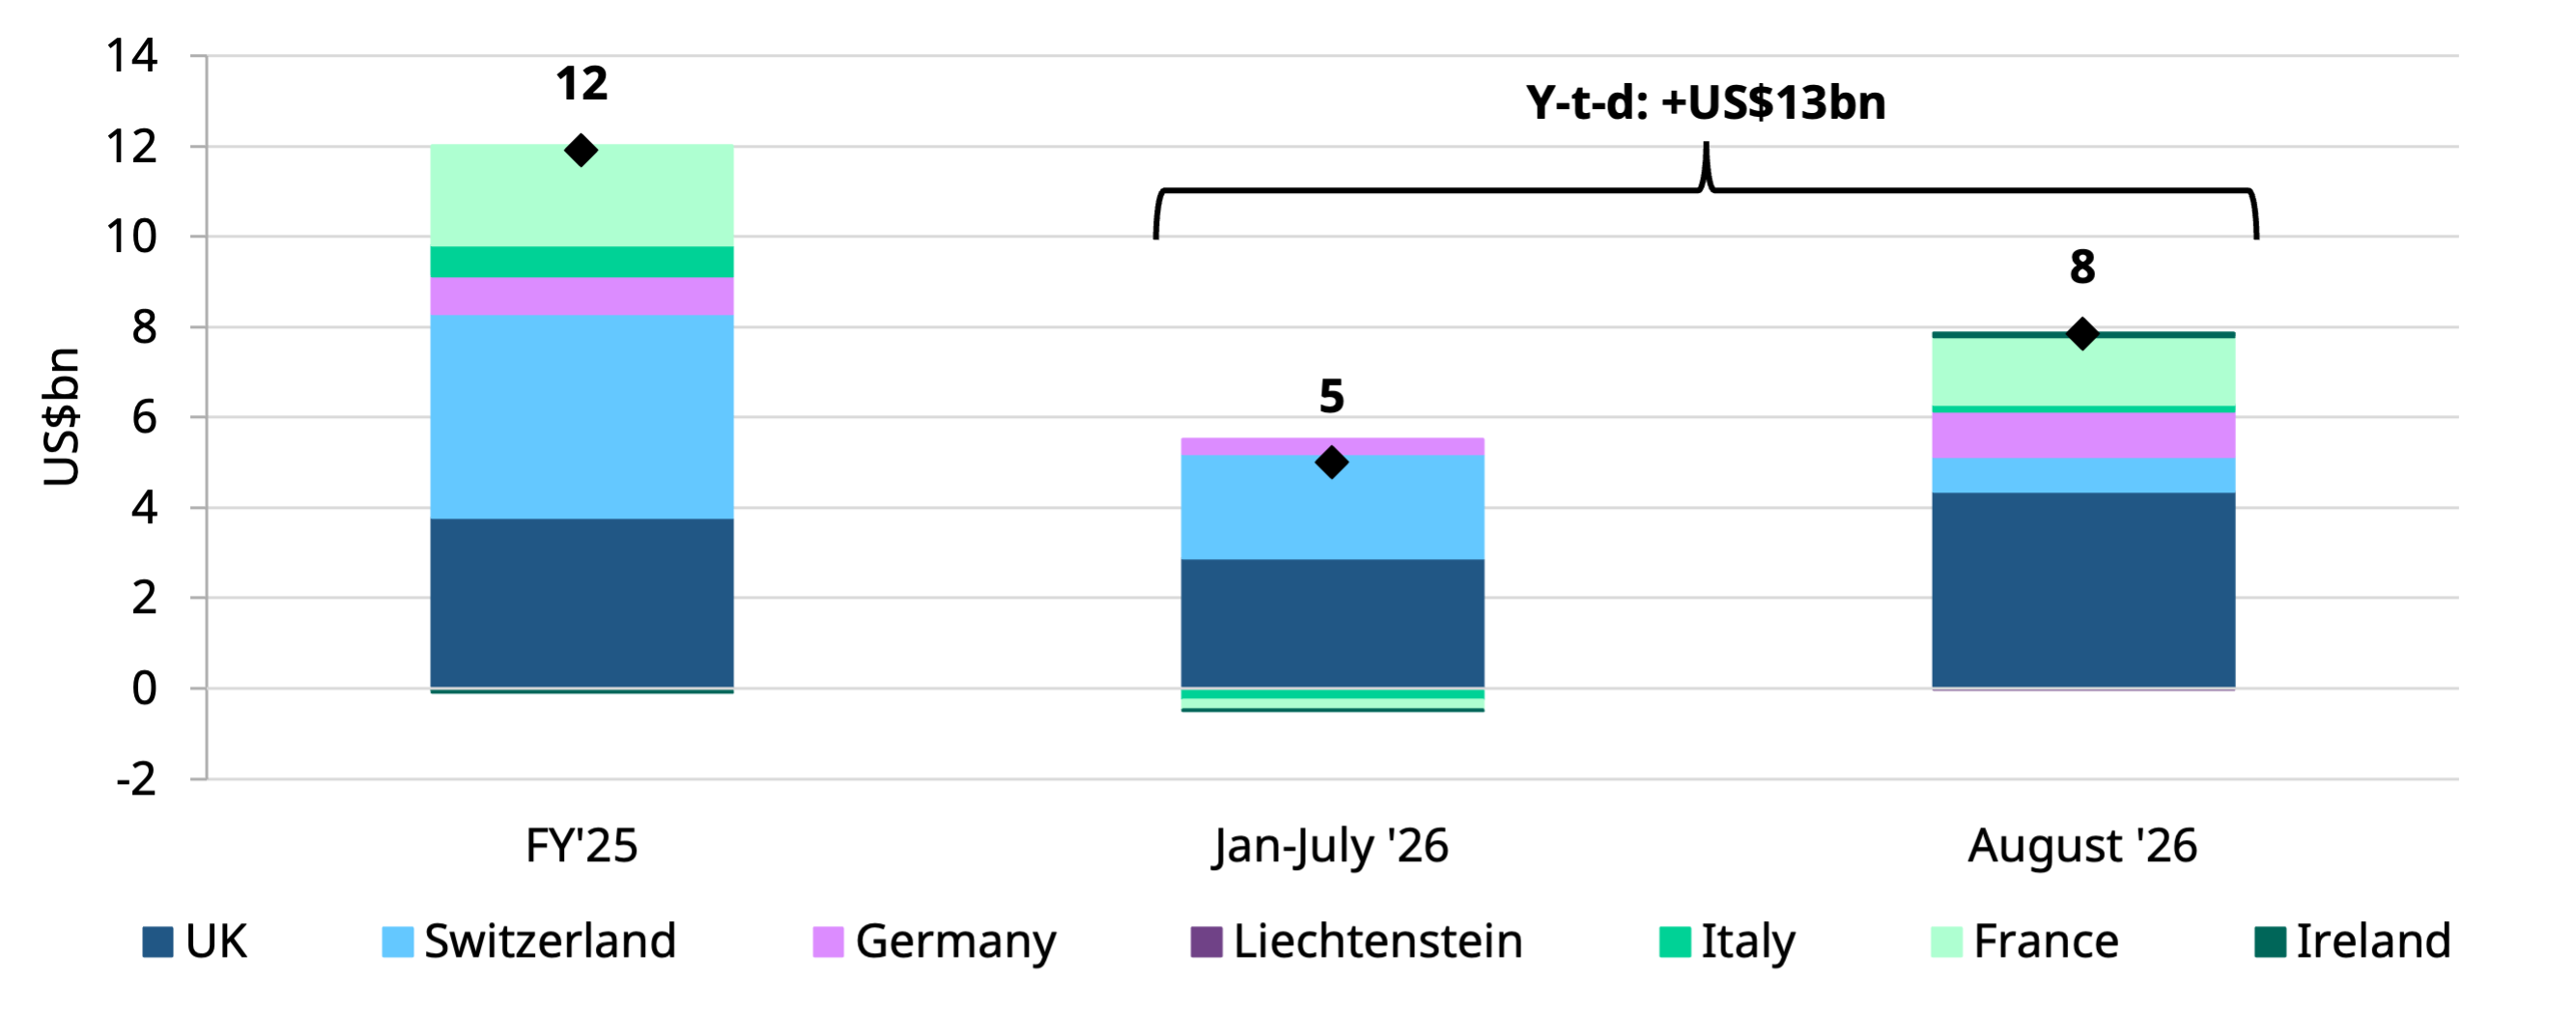
European gold ETFs continued to dominate global inflows in August, witnessing sizable buying of US$7.9bn – the region’s strongest month on record. In addition to many of the factors that supported demand in North America, European investors faced persistent concerns over fiscal sustainability and elevated sovereign borrowing costs.6 Against this backdrop, gold’s role as a portfolio diversifier and an alternative to sovereign debt likely remained an important driver of demand. The continuation of strong buying following July’s rebound also suggests that investors increasingly viewed the summer correction as an opportunity to rebuild strategic positions rather than reduce exposure.
The UK (US$4.4bn) remained the region’s primary source of inflows, recording its second-largest monthly inflow on record (Chart 2). Meanwhile, France added US$1.5bn in the month, its strongest on record, further underscoring the breadth of investor demand across the region.7
Asian funds added US$2bn in August, the strongest month since February. China again dominated regional inflows as stabilising and rebounding local gold prices attracted investor interest and kept the market on pace to surpass FY25’s record year of inflows. Continued declines in local government bond yields and a range-bound equity market likely provided additional support. India and Japan also recorded modest inflows, aided by improving gold price performance.
Gold ETFs listed in other regions continued to attract inflows during August, adding a modest US$234mn. The bulk of this demand came from Australia, which accounted for US$190mn of regional inflows.
Chart 2: European investors return in full force
Net fund flow by country*
*Data as of 31 August 2026.
Source: Bloomberg, Company Filings, World Gold Council










Leave a comment