

The global macro landscape is undergoing profound restructuring. Michael Hartnett, Chief Investment Officer at Bank of America, believes that the winners of the first half of the 2020s were equities, but the market theme in the second half will shift from US stocks and the US dollar to commodities.
In the latest edition of his Flow Show report, Hartnett pointed out that six major structural shifts are driving this rotation: globalization shifting to nationalism, efficiency prioritization giving way to livelihood prioritization, the Federal Reserve moving from independence to compliance, the United States transitioning from open borders to controlled borders, an AI arms race evolving into disruption, and the US service sector pivoting to manufacturing. Coupled with a weakening dollar and excessive global fiscal expansion, commodities have emerged as a risk hedge and inflation hedge for asset allocators.
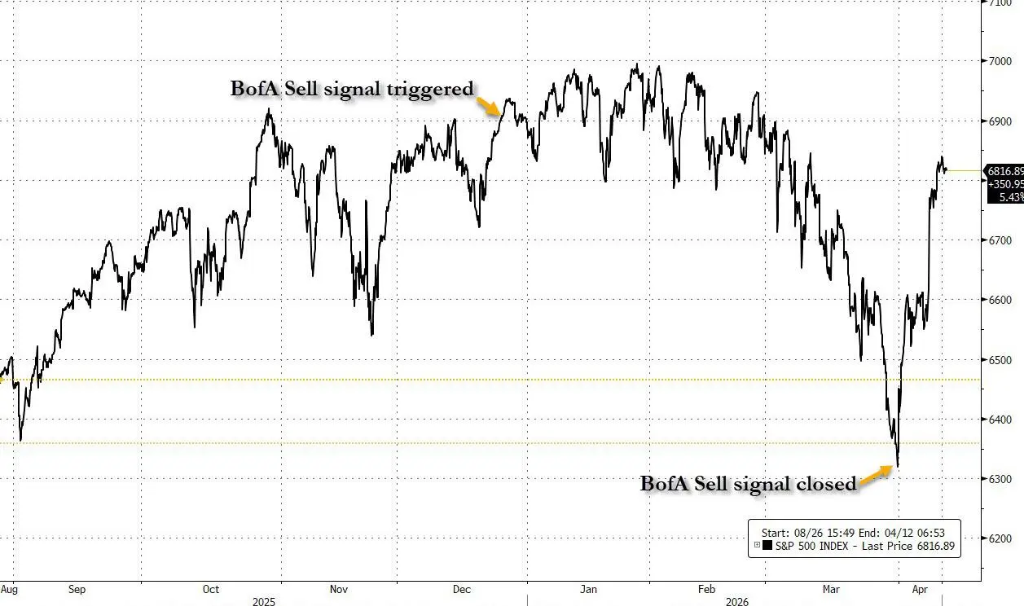
Hartnett’s recent market analysis has once again been validated — his earlier sell signal accurately captured the interim peak of the S&P 500, followed closely by pinpointing the market bottom. Currently, he characterizes market sentiment as transitioning from “sell on rallies” to “new highs in May,” forecasting that equity inflows will reach new records by 2026.

Commodities, international equities, and small-cap stocks will take the lead in the second half of the 2020s.
Hartnett describes the current macro environment as an overlap of deep-seated structural changes. In this context, he predicts that leadership in the second half of the 2020s will shift from the US dollar and large-cap US stocks to commodities, international equities, and small-cap stocks. He writes that commodities now serve both as a risk hedge and an inflation hedge, while the dollar retains only bearish hedging value. Factors such as tariff impacts, the loosening of NATO order, and threats to the OPEC petrodollar cycle collectively pose long-term headwinds for the dollar.
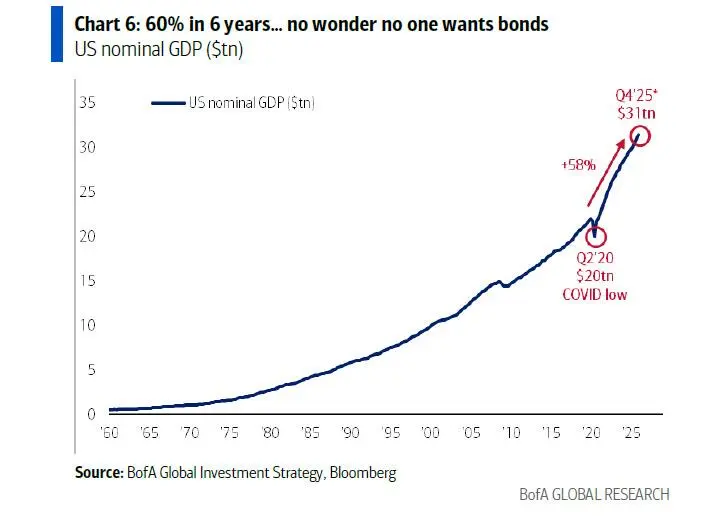
Hartnett also stated that he remains willing to buy 30-year US Treasury bonds when yields reach 5%, viewing them as contrarian allocation opportunities akin to equities in 2008 or commodities in 2018. However, he concedes that government bonds are more likely to experience bear market rallies than genuine bull markets until voters genuinely embrace fiscal discipline. Politicians still need to placate voters with full employment, and fiscal expansion will continue to drive up nominal GDP, which has risen by 60% in the US over six years.
Policy panic is the trump card; the real risk lies in policy failure.
Hartnett cited and paraphrased a famous quote by James Carville: “It’s the stock market’s turn now, James” — to articulate his core thesis: panic among policymakers often signals a market bottom. He notes that since the 2008 global financial crisis, every bear market and correction on Wall Street has been reversed by policy easing.
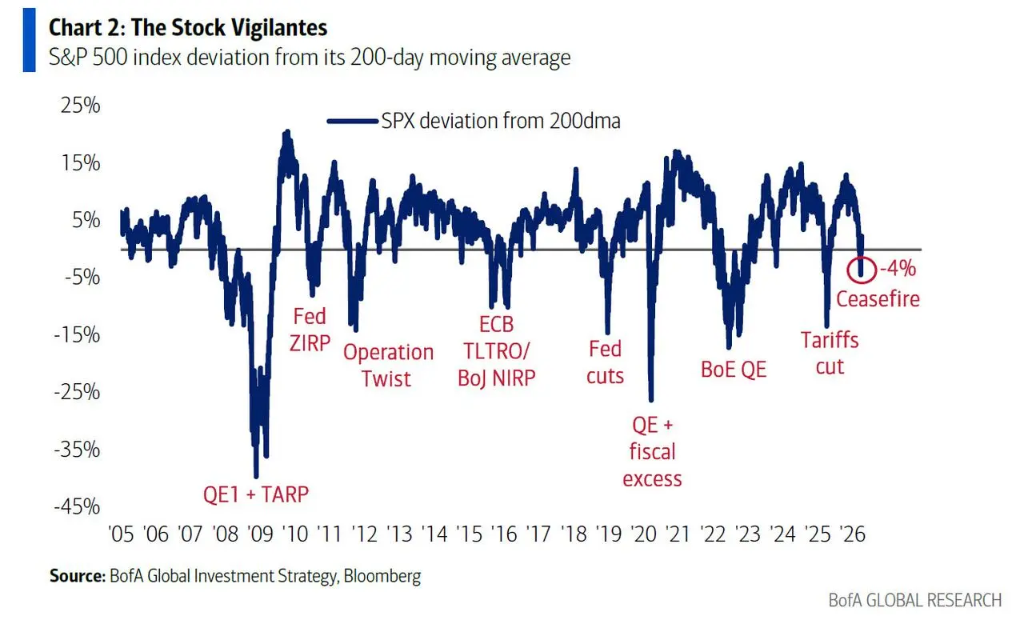
This time is no exception. The S&P 500, after falling only 4% and entering oversold territory, was buoyed by ceasefire news, followed by a seven-day consecutive rally. Hartnett believes that equities have effectively become “too big to fail,” and the real market risk lies in policy failure — namely, a collapse of the dollar or bond market, or the outbreak of a credit event.
From a political perspective, Trump’s overall approval rating stands at 41%, with economic issue support at 37% and inflation issue support at 33%, all hitting new lows but still above Biden’s corresponding lows in 2022. Based on this, Hartnett judges that midterm election pressures will prompt a policy pivot toward easing to improve affordability for ordinary citizens, benefiting consumer stocks.
Capital flows indicate a recovery in risk appetite, but sentiment still has room to decline.
Global capital flow data from last week showed inflows of $70.7 billion into cash, $36.8 billion into equities, $8.7 billion into bonds, $3.5 billion into gold, and $200 million into cryptocurrencies.
Hartnett pointed out that the two major long-term capital trends since 2008 remain solid: passive investments continue to outperform active ones, with cumulative net inflows of $7.1 trillion into equity ETFs compared to cumulative net outflows of $3.4 trillion from long-term equity funds; corporate bonds continue to outperform government bonds, with investment-grade bond funds seeing net inflows of $2.7 trillion versus only $0.9 trillion for U.S. Treasury funds.
The Bank of America Bull & Bear Indicator currently stands at 6.3, within the neutral range – the contrarian “sell signal” triggered on December 17 ended on March 25. Hartnett noted that the April fund manager survey to be released next Tuesday will serve as an important reference.
He highlighted that if an extremely pessimistic reading similar to the one after the “Liberation Day” of April last year were to occur—where global growth expectations fell to a 30-year low of -82%, cash positions rose to 4.8%, and equity allocations dropped to -17%—it would constitute a “buy with eyes closed” signal. While current sentiment is already under pressure, it remains far from extreme levels. At the market bottom in May last year, the low point of the bull-bear indicator was 3.4, significantly lower than the current 6.3.


Leave a comment