

W. R. Berkley (WRB) stock is in focus after the insurer reported stronger than expected Q2 2026 operating income and record net investment income, along with year over year gains in revenue and net income.
See our latest analysis for W. R. Berkley.
The earnings surprise and record investment income appear to be feeding into stronger momentum for W. R. Berkley, with a 1-day share price return of 1.48%, a 30-day share price return of 6.48%, and a 5-year total shareholder return of 153.06%, all of which point to sustained investor interest.
If you are looking for other ideas in this part of the market, it could be a good moment to broaden your search and check out 17 top founder-led companies
Bulls see W. R. Berkley’s earnings beat, buybacks and long run returns as support for a higher valuation, while bears point to its recent price strength and analyst caution. Which side do the current numbers actually support?
Most Popular Narrative: 8% Overvalued
W. R. Berkley last closed at $73.43 against a most followed narrative fair value of $68.33, which frames the current debate around the stock.
Analysts have trimmed their average price targets on W. R. Berkley by a few dollars per share, reflecting more cautious assumptions on revenue growth, slightly higher expected profit margins, and modestly lower future P/E multiples across recent research updates.
Recent research updates on W. R. Berkley cluster around valuation, the property and casualty cycle, and expectations for earnings resilience. Targets have been moved in both directions, but the net effect is a slightly more cautious stance on where the shares should trade relative to prior expectations. Read the complete narrative.
Want to see what sits behind that shift in tone? The core narrative blends softer revenue assumptions with firmer margins and a reset on future earnings multiples. Curious which specific earnings and valuation assumptions pull the fair value below the current price?
Result: Fair Value of $68.33 (OVERVALUED)
Have a read of the narrative in full and understand what’s behind the forecasts.
However, W. R. Berkley’s story could change quickly if softening commercial and reinsurance pricing compresses margins, or if inflation pushes loss costs above current assumptions.
Find out about the key risks to this W. R. Berkley narrative.
Another View: SWS DCF Versus Market Pricing
While the most followed narrative frames W. R. Berkley as about 8% overvalued on a fair value of $68.33, the SWS DCF model points in the other direction, with an estimated future cash flow value of $124.55 per share versus the current $73.43. That gap suggests investors are weighing two very different stories about what matters more: headline multiples or long term cash generation.
Look into how the SWS DCF model arrives at its fair value.
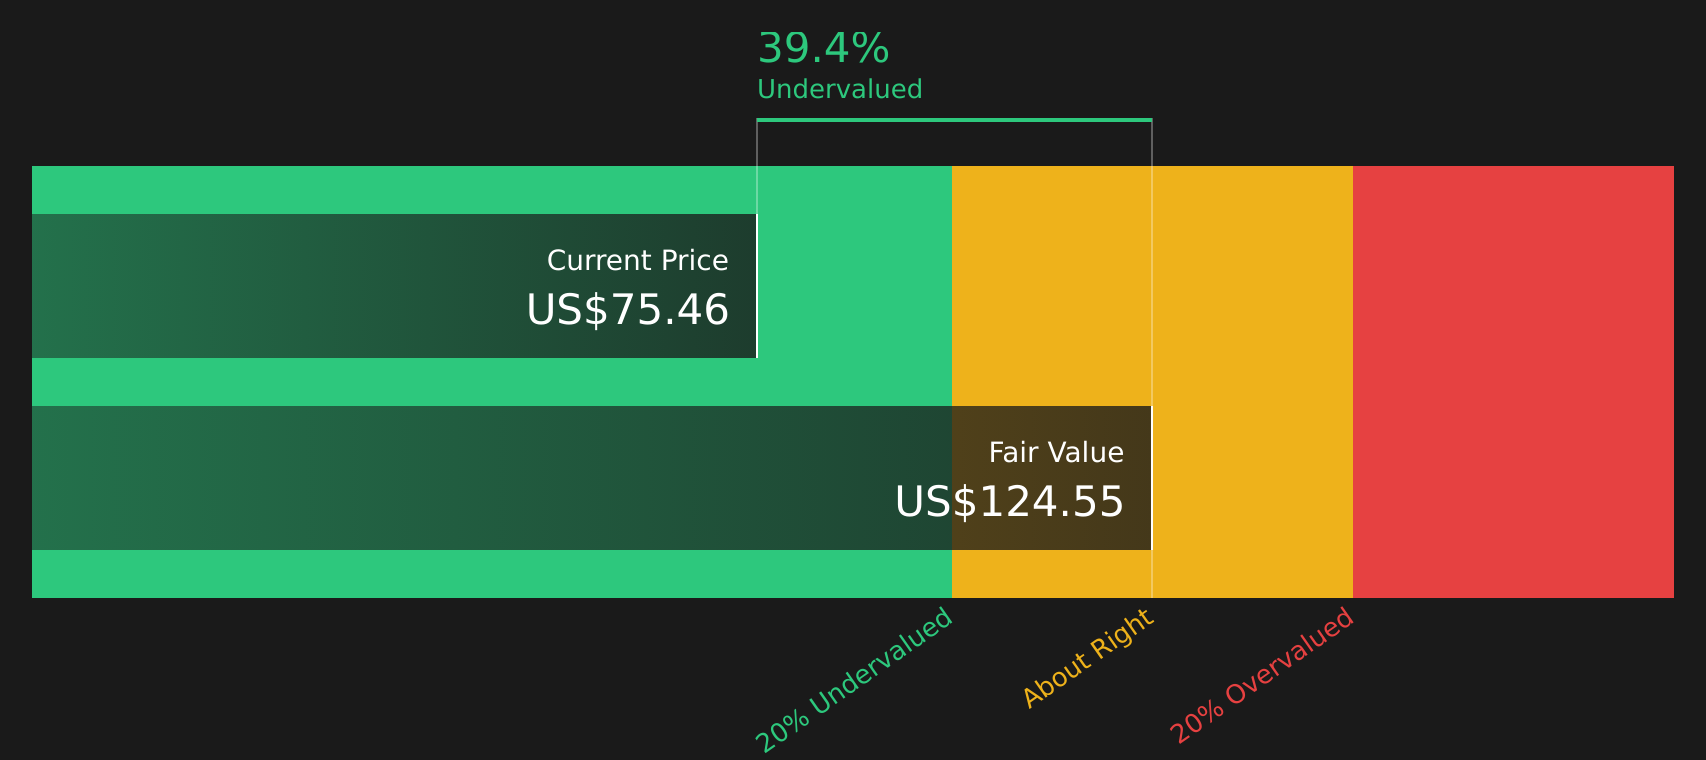
Simply Wall St performs a discounted cash flow (DCF) on every stock in the world every day (check out W. R. Berkley for example). We show the entire calculation in full. You can track the result in your watchlist or portfolio and be alerted when this changes, or use our stock screener to discover 38 high quality undervalued stocks. If you save a screener we even alert you when new companies match – so you never miss a potential opportunity.
Next Steps
Curious whether the mixed sentiment around W. R. Berkley really adds up? Take a close look at the data, weigh the upside and the concerns, and then review the 2 key rewards and 2 important warning signs
Looking for more investment ideas beyond W. R. Berkley?
If W. R. Berkley has sharpened your focus on quality, use that momentum to scan for other stocks that match your style before the next rotation passes you by.
This article by Simply Wall St is general in nature. We provide commentary based on historical data
and analyst forecasts only using an unbiased methodology and our articles are not intended to be financial advice. It does not constitute a recommendation to buy or sell any stock, and does not take account of your objectives, or your
financial situation. We aim to bring you long-term focused analysis driven by fundamental data.
Note that our analysis may not factor in the latest price-sensitive company announcements or qualitative material.
Simply Wall St has no position in any stocks mentioned.
Valuation is complex, but we’re here to simplify it.
Discover if W. R. Berkley might be undervalued or overvalued with our detailed analysis, featuring fair value estimates, potential risks, dividends, insider trades, and its financial condition.
Have feedback on this article? Concerned about the content? Get in touch with us directly. Alternatively, email editorial-team@simplywallst.com













Leave a comment