

Trends in the wealth management industry continue to tip the scales in favor of ETFs. Retail capital continues to desert traditional investment vehicles in favor of more modern structures. More specifically, outflows from mutual funds are translating to inflows for ETFs.
The latest weekly asset flow data released by the Investment Company Institute (ICI), for the week ended July 1, 2026, revealed that this migration has reached a fever pitch. ETFs generated $32.3 billion in net new issuance. Meanwhile long-term mutual funds bled $28.87 billion in net outflows. In the aggregate, the total long-term fund industry saw a modest net weekly inflow of $3.43 billion. However, the divergence in capital between ETFs and mutual funds illustrates that investors aren’t leaving the capital markets, but trading one investment vehicle for another.
Key Takeaways:
- Weekly ICI flow data shows a major structural shift as ETFs pulled in $32.3 billion in net new capital, while traditional long-term mutual funds shed $28.87 billion.
- The structural gap is most aggressive in equities, where domestic equity ETFs gained $16.27 billion in weekly inflows while domestic equity mutual funds bled $22.10 billion.
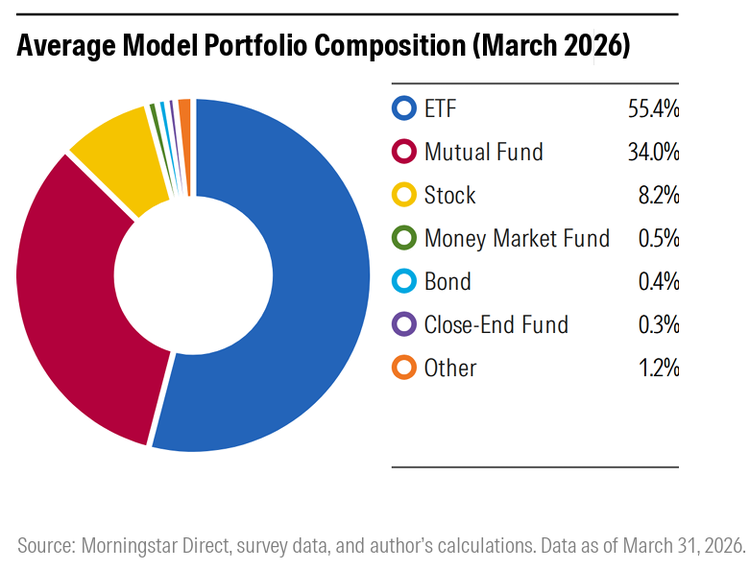
- ETFs now occupy 55% of all model portfolio allocations, driven by distinct advantages over mutual funds including a lower average fee hurdle, intraday liquidity, and inherent tax efficiency.
Content continues below advertisement
Equity and Fixed Income Fund Splits
The gap between the two fund structures is most apparent in the equity markets. Equity ETFs saw an influx of $19.70 billion for the week. This was heavily driven by domestic equity allocations that took in $16.27 billion alongside a $3.42 billion slice for world equities.
Conversely, traditional equity mutual funds were hit with $29.91 billion in net outflows. Domestic equity funds lost $22.10 billion and world equity funds parted ways with $7.81 billion in capital. When it came to hybrid funds, ETFs gained $316 million while mutual funds dropped $2.69 billion.
Fixed income provided the only bright spot for mutual funds, but still lagged ETFs. Bond ETFs captured a robust $14.94 billion in net issuance, which was highlighted by $13.15 billion in taxable bond products and $1.79 billion in municipal options. Bond mutual funds took in $3.73 billion in net weekly inflows ($3.00 billion taxable and $726 million municipal).
ETFs Becoming a Model Citizen
One of the pervasive topics discussed at ETF Exchange 2026 was the proliferation of model portfolios. One of the sessions, “The Model Moment: Allocating in a High Dispersion Market,” dove deeper into this increasing trend.
Modern portfolios act as guideposts for constructing portfolios based on an investor’s risk profile, goals, and other metrics. For an investor, the appeal is its ease and transparency within an automated system. For the advisor, it offers a turnkey solution so they can redirect their attention to what matters most: serving the client. In both instances, efficiency in time and cost are mutual benefits.
ETFs are continuously finding themselves at the epicenter of these model portfolios. As of March 2026, Morningstar data revealed that ETFs occupied an average of 55% of all model portfolio allocations, which is up significantly from 43% just five years ago.
Furthermore, custom model portfolio assets have skyrocketed, hitting $258 billion at the end of March 2026 — a spectacular 40% gain over the previous year. Advisors are utilizing these models to customize client accounts through seamless fund substitutions, asset-class adjustments, and tactical allocation tweaks to better align with a client’s unique needs.
See More: Model Portfolios Gain Momentum in 2026: How ETFs Fit In
ETF vs. Mutual Fund: 3 Advantages for Investors
Despite the wide industry adoption of ETFs, many traditional retail investors remain unaware of the structural mechanics driving the migration from mutual funds into ETFs. The shift can be summarized into three distinct structural advantages.
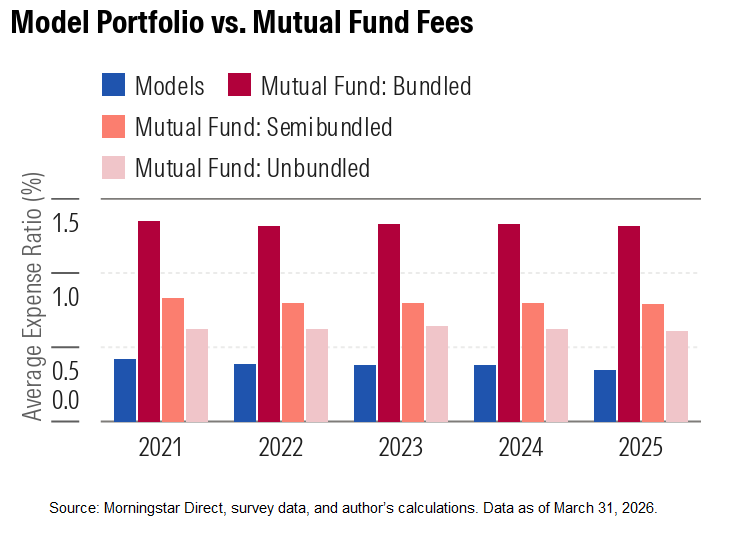
Lower Fee Hurdles: Model portfolios featuring ETFs maintain a massive pricing edge over mutual funds according to Morningstar data. At year-end 2025, model portfolios carried an average 0.35% asset-weighted fee, which is drastically lower than the 0.61% average for unbundled mutual funds. On average, allocation models were 0.25 percentage points cheaper than even the lowest-cost mutual funds across 10 core Morningstar Categories.
Intraday Liquidity: While mutual funds only price and trade once per day after the closing bell, ETFs offer instant intraday liquidity. As such, they allow advisors to react immediately to market movements or rebalance models dynamically throughout the trading session.
Tax Efficiency: Mutual funds routinely pass capital gains taxes on to remaining shareholders when managers sell underlying assets to meet fund redemptions. Conversely, ETFs inherently utilize an in-kind creation and redemption mechanism that shields investors from these tax implications.
Ongoing Shift Towards ETFs
The aforementioned flows data continues to support the notion that more investors are gravitating towards ETFs. The asset flows reported by the ICI reinforce the idea that ETFs are playing a larger role in how American wealth is managed, especially with regard to the proliferation of model portfolios.
Ultimately, the data underscores a structural evolution rather than a passing trend. By pairing the cost efficiency, tax, and liquidity advantages of ETFs with the tailored precision of model portfolios, financial advisors are increasingly turning to ETFs as a core component in the wealth management experience.
Originally published by Advisor Perspectives
For more news, information, and analysis, visit the Equity ETF Content Hub.














Leave a comment