
The research framework
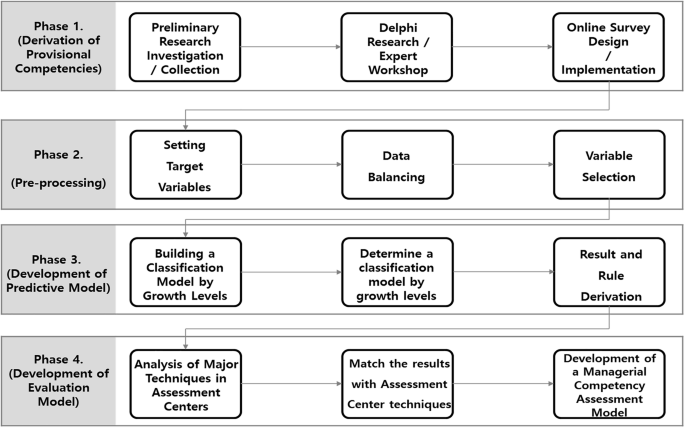
The purpose of the study is to derive the core competencies and performance rules of managers in IP-based startups, linked to actual business performance, and to develop an improved evaluation model for systematically measuring managerial competencies in technology assessments. To achieve this, data from actual IP-based startup managers were collected. The sample was selected from companies participating in a government-verified IP-based startup support program. To ensure high-quality data, factors such as industry, region, and revenue size were considered, and data were collected using an online survey method. The collected data were utilized to develop predictive models through the application of machine learning. As Fig. 1 illustrates, the research framework can be broadly divided into four main stages: (1) the tentative competency derivation; (2) pre-processing; (3) prediction model development through growth level classification (feature selection and prediction model); and (4) developing a technology evaluation model based on key techniques gathered from the assessment centers.

(This figure describes the research procedure in four stages, detailing the processes of deriving potential competencies, applying machine learning, and developing an evaluation model).
Deriving the provisional competencies
This section uses the Delphi method and expert workshops to validate the tentative managerial competencies; confirmed competencies are then used as independent variables in a survey targeting managers of IP-based startups. The Delphi method facilitates consensus by gathering expert opinions through iterative surveys and structured feedback. Unlike general surveys, it emphasizes repeated rounds to refine agreement. Its effectiveness relies heavily on the careful selection of panel members. Previous research has suggested that approximately 10 experts typically yield reliable results, with participant diversity and consensus-building methods being critical success factors (Ewing, 1992; Anderson, 1997). The current study used purposive sampling to select a panel of experts with both theoretical knowledge and practical experience in startup management, guidance, or consulting. Panel details are provided in Table 5.
The Delphi method in this study was conducted in three rounds, each with a specific objective. The first round aimed to refine the initial list of tentative competencies, resulting in a consolidated set of 52 competencies. In the second round, these competencies were classified and structured to form a preliminary competency framework. The third round focused on finalizing the competencies through expert consensus. This multi-round approach enabled the systematic refinement of managerial competencies based on their perceived importance. The reliability of the Delphi process was supported by a content validity ratio (CVR) of 0.87, which exceeded the 0.62 threshold recommended by Lawshe (1975), confirming strong validity and reliability.
Despite these results, the study recognized limitations in relying exclusively on the Delphi method, as no prior research has specifically addressed managerial competencies in IP-based startups. To address this limitation, an additional expert workshop was held to redefine and reorganize the derived competencies in alignment with the unique management environment of IP-based startups. Six experts, selected from the original Delphi panel due to their deep understanding of the study, participated in the workshop. Conducted face-to-face over eight hours, this session enabled a more tailored and context-specific competency framework. For the workshop, we utilized Spencer and Spencer’s (1993) future-oriented competency development method. This expert workshop allowed the restructuring of the existing competency area to consider the characteristics of IP-based startups. The provisional competency divisions from the Delphi method (common competencies, leadership competencies, and job competencies) were redefined into the following areas:
-
Business: these competencies focused on the business performance necessary for sustaining essential and continuous business operations.
-
Value: these competencies focused on the foundational qualities and values that startup managers pursued.
-
People: these competencies focused on the interactions necessary for exerting influence on others, such as customers and employees, in managing startups.
Table 6 presents the finalized managerial tentative competencies from the workshop. These results were then used as independent variables for collecting the actual survey data.
Data preprocessing
In this study, the target variable was the actual compound annual growth rate (CAGR) of IP-based startups. CAGR is a measure that represents the mean annual growth rate of an investment over a specified time period that is longer than one year, assuming the profits are reinvested at the end of each period. It is an advantageous way to compare the growth rates of businesses over the same period and is one of the most robust indicators for predicting a company’s growth potential. Traditional competency modeling often uses variables like employee satisfaction with managers or managers’ self-assessed job satisfaction as target variables. However, these subjective indicators have limitations in accurately reflecting actual managerial performance. Instead, this study uses annual business growth rate as an objective performance indicator to identify core competencies. Based on the OECD’s classification of high-growth enterprises, the growth rate was categorized into three levels (i.e., high, medium, and low growth) to improve analytical efficiency and enhance the clarity and interpretability of the derived performance rules linked to managerial competencies.
Data balancing
When building a predictive model using machine learning, data balancing of the target variable was performed to prevent biased predictions. Data balancing helps avoid biased predictions by understanding the class distribution of the target variable. Therefore, a data-balancing process was conducted to align the proportions of each class within the target variable.
Two sampling techniques were considered: over-sampling and under-sampling. Over-sampling increases the representation of minority classes by duplicating existing instances, which expands the dataset but may lead to overfitting. Under-sampling reduces the majority class to match the minority, which avoids overfitting but may discard valuable data. In big data contexts, the drawbacks of under-sampling can be mitigated (Choi and Yoo, 2016).
To assess model robustness across different sampling methods, this study conducted 10 iterations per technique and compared average performances. The model used was in its initial state without feature selection, and all other conditions were held constant. For the no-sampling case, 10 datasets were generated using varying training and validation splits. Under-sampling and over-sampling employed random sampling to create 10 datasets each. The results are presented in Table 7.
As shown, the over-sampling technique achieved the highest average accuracy, precision, and F1-score, indicating better overall predictive performance. Although under-sampling slightly outperformed in recall, over-sampling offered a more balanced and robust result. Given the limited size of survey-based data, over-sampling was selected despite potential overfitting risks, as it avoids the information loss associated with under-sampling. Consequently, a dataset with 243 over-sampled instances was used for the machine learning analysis.
Variable selection
The method used for variable selection in this study primarily involved the wrapper approach. The wrapper method involves selecting subsets of input variables and applying a specific algorithm to evaluate the performance, thereby determining the optimal set of input variables through iterative subset formation and algorithm application (Witten and Frank, 2005). This approach can be divided into two main strategies: backward elimination and feedforward selection.
The backward elimination approach removes the least significant variable in each iteration, develops a predictive model, and recalculates the ranking for the importance of the independent variables. This approach allows for the assessment of the current variables’ importance by eliminating the influence of previously excluded variables. Conversely, feedforward selection calculates the importance ranking of variables at the beginning and then adds the most important variable to the model one by one, evaluating the model’s performance and stopping at the appropriate point (Witten and Frank, 2005). In this study, backward elimination was chosen as the variable selection method, as it is generally recognized for its superior performance in identifying optimal feature sets.
Development of the prediction model
In this study, machine learning was employed with a focus on enhancing prediction accuracy, rather than relying on traditional statistical methods (Dua and Du, 2016; Mitchell, 1997). By learning from extensive training data, machine learning algorithms are capable of recognizing patterns and minimizing classification and prediction errors for individual records. These algorithms are generally classified as supervised, unsupervised, or semi-supervised, depending on whether the target variable is labeled. Among these, decision trees are a commonly used supervised learning algorithm. They classify data based on predefined labels and utilize a flowchart-like structure that splits variables into binary decisions, making the model both intuitive and interpretable (Genuer and Poggi, 2020; Smith, 2017). This approach makes decision trees especially effective for identifying rules and patterns in raw data, which is essential for predicting business outcomes (Rokach and Maimon, 2015).
In this study, a C4.5-based decision tree algorithm was used to derive performance rules associated with actual business growth. As a classification analysis method, C4.5 enhances prediction accuracy by partitioning data based on the gain ratio, thereby maximizing the informational value of input variables. Moreover, C4.5 is known for its high explanatory power, generating transparent rules that help clarify links between managerial competencies and business growth. Although other machine learning algorithms such as random forests or artificial neural networks may achieve higher predictive performance, they are limited in interpreting and extracting rule-based patterns, which is essential for managerial competency evaluation.
A total of 42 provisional competencies were initially selected as input variables. Variable selection was conducted using a backward elimination approach, removing the least significant variables iteratively to optimize model performance. The data analysis was performed using Weka 3.8.6, an open-source platform widely used in academic research. The dataset was divided into training and testing sets using an 80:20 ratio, and the minNumObj parameter for the decision tree was set to 7. This configuration yielded a prediction accuracy of 61.2%, indicating a high level of model performance. The results for optimal prediction rates and variable selection are presented in Table 8.
Among the predictive models developed through backward elimination, the core competencies were defined as the independent variables in the model that achieved the highest performance in predicting high company growth. This analysis directly addresses RQ1: What are the core competencies of managers in IP-based startups that are related to business growth?
Based on the results of the predictive model with the highest prediction rate, a total of 13 variables were used (i.e., C18, C2, C12, C30, C1, C17, C32, C20, C9, C8, C27, C25, and C28), achieving a top prediction rate of 61.2%. Accordingly, managers’ core competencies were finalized to be a total of 13. When the tentative managerial competencies were initially derived, we structured them into three categories using the Delphi method and workshops. Analyzing the derived core competencies across these three categories revealed that balanced results were obtained without any bias toward a specific category, thereby providing further evidence that the competency modeling method using the machine learning algorithm was appropriate. The structured and summarized results of the competency modeling for managers of IP-based startups are presented in Table 9.
Using the selected core competencies, a decision tree analysis was conducted to derive growth-level rules for IP-based startups. The accuracy of the rules generated by the final decision tree ranged from 45% to 80%, with an average of 63%, indicating robust performance. Given that the target variable was categorized into three groups (i.e., high, medium, and low growth), this level of accuracy is notably above average. The decision tree analysis yielded 11 growth-level rules, which are visually presented in Fig. 2.
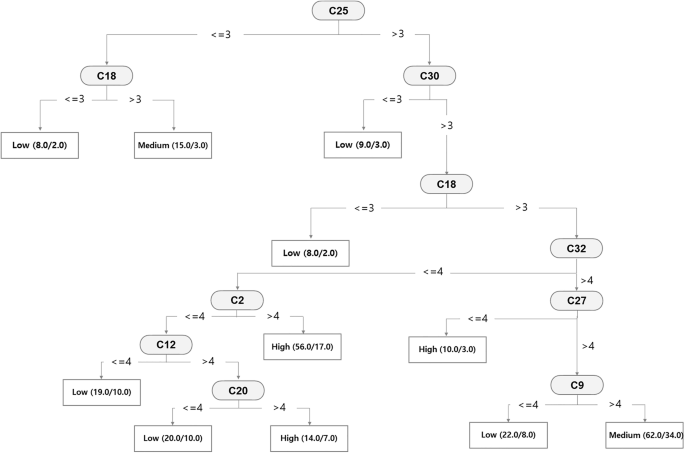
(This figure describes the rules of key competencies according to the classification of the target variable, which is the annual average growth rate).
As Fig. 2 illustrates, the decision tree rules are distributed as follows: 3 rules for high-growth startups, 2 for medium-growth startups, and 6 for low-growth startups. This classification is also summarized in Table 10. The derived rules not only distinguish growth levels but also highlight the importance of core competencies at each node. The machine learning-based competency modeling presented in this study offers both detailed performance rules and priority information among competencies, enabling practical applications. As shown in Table 10, the growth-level rules can serve as reference indicators in managerial competency evaluations.


Leave a comment