 shareholders five-year gains to 584%")
We think all investors should try to buy and hold high quality multi-year winners. And highest quality companies can see their share prices grow by huge amounts. Don’t believe it? Then look at the A-Mark Precious Metals, Inc. (NASDAQ:AMRK) share price. It’s 445% higher than it was five years ago. And this is just one example of the epic gains achieved by some long term investors. In more good news, the share price has risen 20% in thirty days.
Since the stock has added US$59m to its market cap in the past week alone, let’s see if underlying performance has been driving long-term returns.
See our latest analysis for A-Mark Precious Metals
There is no denying that markets are sometimes efficient, but prices do not always reflect underlying business performance. By comparing earnings per share (EPS) and share price changes over time, we can get a feel for how investor attitudes to a company have morphed over time.
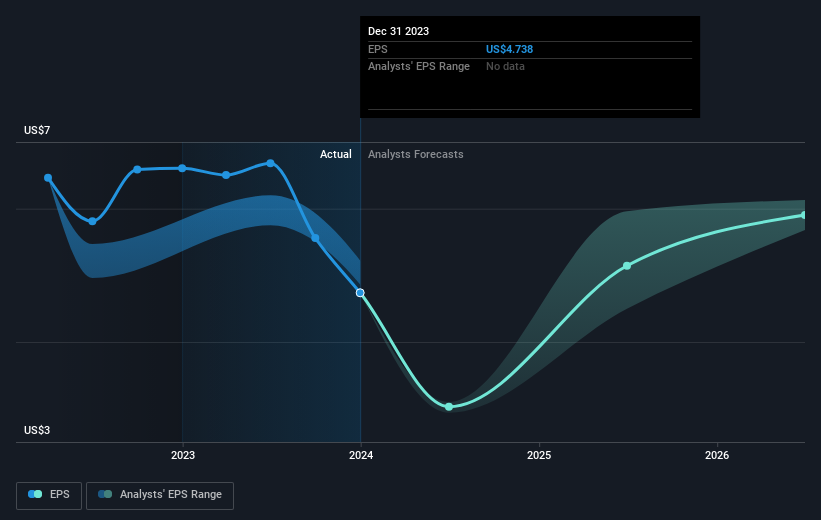
During the last half decade, A-Mark Precious Metals became profitable. Sometimes, the start of profitability is a major inflection point that can signal fast earnings growth to come, which in turn justifies very strong share price gains. Given that the company made a profit three years ago, but not five years ago, it is worth looking at the share price returns over the last three years, too. We can see that the A-Mark Precious Metals share price is up 73% in the last three years. In the same period, EPS is up 3.6% per year. This EPS growth is lower than the 20% average annual increase in the share price over three years. So one can reasonably conclude the market is more enthusiastic about the stock than it was three years ago.
The image below shows how EPS has tracked over time (if you click on the image you can see greater detail).
It’s probably worth noting we’ve seen significant insider buying in the last quarter, which we consider a positive. On the other hand, we think the revenue and earnings trends are much more meaningful measures of the business. Dive deeper into the earnings by checking this interactive graph of A-Mark Precious Metals’ earnings, revenue and cash flow.
What About Dividends?
It is important to consider the total shareholder return, as well as the share price return, for any given stock. The TSR incorporates the value of any spin-offs or discounted capital raisings, along with any dividends, based on the assumption that the dividends are reinvested. Arguably, the TSR gives a more comprehensive picture of the return generated by a stock. As it happens, A-Mark Precious Metals’ TSR for the last 5 years was 584%, which exceeds the share price return mentioned earlier. This is largely a result of its dividend payments!
A Different Perspective
While the broader market gained around 29% in the last year, A-Mark Precious Metals shareholders lost 6.6% (even including dividends). However, keep in mind that even the best stocks will sometimes underperform the market over a twelve month period. Longer term investors wouldn’t be so upset, since they would have made 47%, each year, over five years. It could be that the recent sell-off is an opportunity, so it may be worth checking the fundamental data for signs of a long term growth trend. While it is well worth considering the different impacts that market conditions can have on the share price, there are other factors that are even more important. For example, we’ve discovered 4 warning signs for A-Mark Precious Metals (1 is significant!) that you should be aware of before investing here.
A-Mark Precious Metals is not the only stock insiders are buying. So take a peek at this free list of growing companies with insider buying.
Please note, the market returns quoted in this article reflect the market weighted average returns of stocks that currently trade on American exchanges.
Valuation is complex, but we’re helping make it simple.
Find out whether A-Mark Precious Metals is potentially over or undervalued by checking out our comprehensive analysis, which includes fair value estimates, risks and warnings, dividends, insider transactions and financial health.
Have feedback on this article? Concerned about the content? Get in touch with us directly. Alternatively, email editorial-team (at) simplywallst.com.
This article by Simply Wall St is general in nature. We provide commentary based on historical data and analyst forecasts only using an unbiased methodology and our articles are not intended to be financial advice. It does not constitute a recommendation to buy or sell any stock, and does not take account of your objectives, or your financial situation. We aim to bring you long-term focused analysis driven by fundamental data. Note that our analysis may not factor in the latest price-sensitive company announcements or qualitative material. Simply Wall St has no position in any stocks mentioned.