
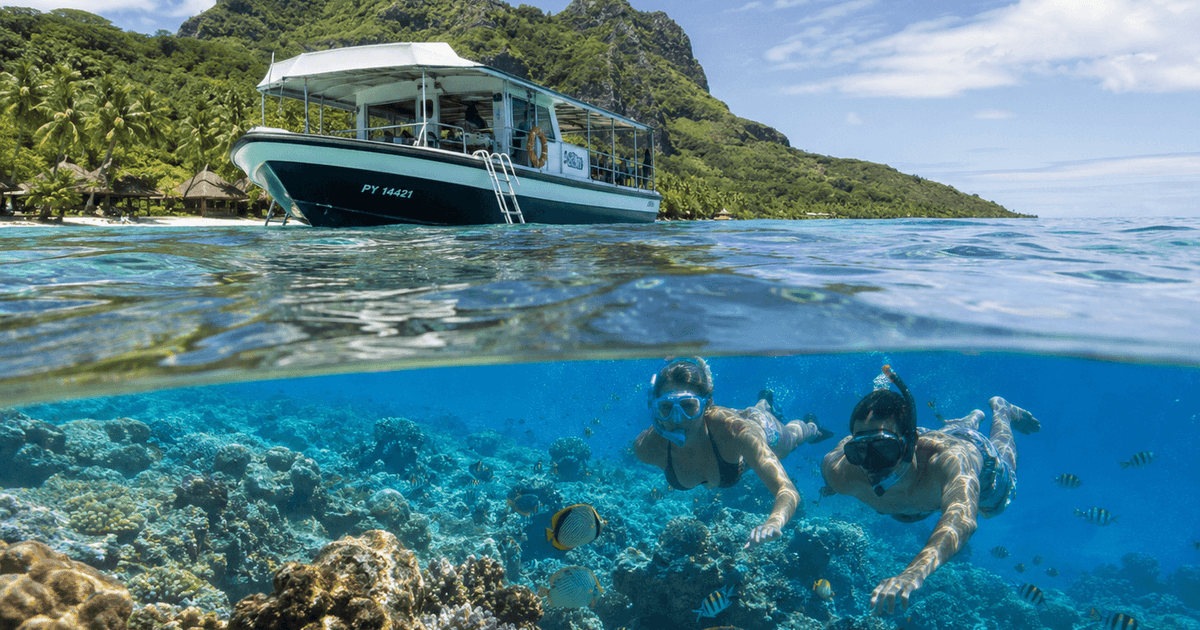
Ten years ago, the hospitality sector quietly agreed that branded residences were the next premium opportunity to monetize what hotels already had — land, brand, location, service infrastructure. The owners who acted early captured a 15-25% brand premium. The owners who waited paid for the lesson. The marine excursion economy around coastal and island hotels is now exactly where branded residences sat in 2014: a USD 67 billion adjacent market, growing at 12-14% per year, largely captured by third parties, and structurally available to be reclaimed by owners who understand what they actually own.
What hotel owners actually own — and what they have been treating as somebody else’s market
The conventional understanding of a coastal hotel asset is straightforward. The owner owns the land, the building, the brand license (or the right to negotiate one), the operating agreements, the working capital tied up in the operation. The asset class is, in the language of institutional capital, a real estate asset with an operating business attached to it. Investors model it. Lenders finance it. Brands operate it. Owners report on it. The category is mature, the analytical frameworks are stable, and the conversation in the industry — at conferences, in pitch decks, in due diligence reports — is largely about how to optimize what is, at this point, a very well-understood asset.
What this conventional framing misses is that every coastal and island hotel asset sits inside a marine economy whose size, growth and economics the owner is rarely asked to understand, model or capture. The reef, the marine reserve, the proximity to a wreck, the access to a quality stretch of coastline — these are not amenities of the asset. They are the asset class adjacent to the asset, and they generate demand for activities whose revenue flows almost entirely outside the hotel’s P&L today.
Industry data on this adjacent economy is now clear enough to take seriously. The global tours and activities market is sized at over USD 300 billion, third largest in tourism after accommodations and air travel. Within it, marine and water-based activities account for an estimated USD 67 billion, second only to city and cultural tours and growing at 12-14% CAGR. Boat tours and yacht charter lead with 28% of the marine segment, followed by diving and snorkeling at 22%, motorized PWC at 16%, paddle sports at 12%, surf and wind sports at 9%, sport fishing at 8%, passenger submarine excursions at 3%, and whale watching at 2%.
For the owner of a coastal resort, the relevant figure is not the global aggregate. It is the slice of that economy that passes through, around or adjacent to their asset every year. In most properties I have analyzed, that slice — measured by guest spend on marine activities during their stay — runs between 8% and 14% of total guest spend per stay. Almost none of it touches the hotel’s revenue line. The owner is, in effect, watching a parallel economy operate on top of their asset and earning a courtesy commission that bears no relationship to the value being created.
The branded residences analogy — and why owners should take it seriously
There is a useful historical parallel for owners thinking through what to do about this. Ten years ago, the hospitality industry had a comparable conversation about branded residences. The pattern was almost identical to what marine excursions look like today: a large adjacent market — residential real estate near or attached to hotel properties — being captured by third parties (developers, branded residence platforms, individual investors) while hotel owners watched from the lobby.
The branded residences shift took roughly five to seven years to play out. The owners who acted early — Aman, Four Seasons, Mandarin Oriental, Six Senses, then Ritz-Carlton and Marriott Luxury — built portfolios in which the residence component generates 15-25% brand premium and, more importantly, allows partial monetization of CapEx, stabilization of long-term cash flow, and a structural improvement in the exit multiple of the underlying hotel asset. The owners who waited are now paying a premium to enter a category in which the best locations have been claimed and the operating playbook has been codified by competitors.
The marine excursion economy is, structurally, in the position branded residences occupied in 2014. The market is large enough to matter (USD 67B and growing), operationally complex enough that capturing it requires deliberate investment, and currently dominated by third-party platforms (Viator, GetYourGuide, TUI Musement, Klook, Civitatis) and local operators who have built their businesses precisely because hotel owners did not. The question for owners is whether to repeat the branded residences pattern — wait, watch, acquire late at a premium — or to act now while the category is still structurally available.
What hotel owners are giving up, in concrete terms
Let me put numbers to this in the form an asset manager would recognize. A typical coastal resort with 250 keys, ADR of EUR 280, occupancy of 75%, and annual rooms revenue of approximately EUR 19 million sits inside a marine excursion economy that — assuming average industry capture rates — generates between EUR 1.8 and EUR 3.2 million of guest spend per year on marine activities while those guests are in the property’s catchment area.
Of that EUR 1.8-3.2 million, the hotel typically captures between 3% and 7% as concierge commission from third-party operators. The hotel that operates its own marine programme captures 50-65% gross margin on the same activity base. The hotel that has an exclusive partnership with a branded operator captures 15-25% via revenue share. The hotel integrated with a global aggregator API captures 5-12%. These are the four operating positions available. Three of them generate meaningfully more economic value than the default position most owners currently occupy.
The annualized impact on the owner’s economics, conservatively modeled, sits between EUR 150,000 and EUR 600,000 per year for the property described above. Capitalized at a hospitality cap rate of 6.5%, that is between EUR 2.3 million and EUR 9.2 million of asset value the owner is currently choosing not to create. For a portfolio of ten comparable assets, the implied value left on the table is between EUR 23 million and EUR 92 million. These numbers are not aggressive. They are what the data on capture rates and operating margins implies for an average property operating in this category in 2026.
The four operating models — and the strategic choice owners need to make
There are four positions an owner can take with respect to the marine excursion economy around their asset. Each is internally consistent, each has different capital and operational implications, and each generates a different long-term asset value trajectory.
The first position is in-house operation with proprietary fleet. The owner (through the operator) acquires the boats, the dive infrastructure, the staff. Capital intensity is meaningful, ranging from EUR 1.5 to EUR 6 million depending on scope. Gross margin is 50-65%. This fits ultra-luxury island resorts with controlled marina access, where brand control over the guest experience justifies the operating complexity. Four Seasons Maldives, Anantara Thailand and Iberostar in selected Caribbean resorts have implemented this model.
The second position is exclusive partnership with branded excursion operators. The owner directs the operator to select one or two preferred third-party operators per activity, integrate booking into the property CRM, and structure revenue share at 15-25%. Capital intensity is minimal. Speed to launch is fast. This is the fastest-growing model in 2025-2026, and the one I most often recommend to owners without appetite for in-house operation. Mandarin Oriental, Rosewood and Marriott Luxury Brands have moved decisively in this direction.
The third position is platform integration with global aggregators. The brand group integrates directly with Viator, GetYourGuide or TUI Musement via API, providing guests access to the full excursion catalogue through the property’s digital channels. Commission is 5-12%. Margin is the lowest of the three active models, but operational simplicity is highest. This fits large brand groups managing many properties across diverse destinations.
The fourth position is concierge-led booking with no formal partnership. The legacy default. Margin is minimal, guest experience varies by individual concierge judgment, and the property captures no structured data on which excursions resonate with which guest profiles. This is where most properties currently sit — not by strategic choice, but because no one has previously asked the owner to make a different one.
The strategic point is that all four positions are valid for some properties. What is not valid is occupying the fourth position by default while the asset’s adjacent marine economy compounds outside the owner’s reach. The choice between positions is an owner-level decision. It needs to be on the owner’s agenda, modeled in the owner’s business plan, and revisited as part of the asset’s strategic review.
What I tell owners to ask before the next budget cycle
When I am brought in to advise an owner on a coastal or island asset, there are four questions I now insist appear on the strategic agenda before any operational discussion takes place. These questions are not advanced. They are diagnostic. And in my experience, the answers reveal more about how the asset has been managed than any operational dashboard.
What is the estimated size of the marine excursion economy around our asset, per year, by category? If the owner cannot answer this, no operating decision about the category will be properly informed. The data exists. Industry benchmarks are reasonable starting points. Local operator revenue is often public or estimable. The exercise is not difficult; it is simply not currently being done.
What percentage of that economy are we currently capturing through commissions, partnerships or in-house operation? The number is calculable, even when the property has not historically tracked it. The number is also, in nearly every property I have analyzed, embarrassingly low relative to what the data on capture rates implies is achievable.
Which of the four operating positions are we currently occupying, and was that a deliberate choice? If the answer is the fourth, and the choice was not deliberate, that is a strategic gap that the next budget cycle should address. It is not a marketing tactic or a guest experience initiative. It is an owner-level strategic decision with capital, operational and asset-value consequences.
What would it take, in capital, operating capacity and timeline, to move from our current position to the position that would maximize asset value over the next five years? The answer will vary by asset, but the exercise of building it forces the conversation that most owners are not having. The output of that exercise is the operational and capital plan for capturing the adjacent economy that today is being captured by someone else.
Why this matters now, and not in three years
The marine excursion economy is consolidating. Viator, GetYourGuide and TUI Musement now command an estimated combined USD 14.5 billion in tours and activities GMV, growing fastest where local infrastructure is weakest — which is to say, where owners have most clearly defaulted on the category. Atlantis Submarines has consolidated submarine excursion operations across Hawaii, the Caribbean and Guam over four decades; entering that category now would require multi-year capital investment that was a fraction of the cost twenty years ago. The branded operators (Burgess and Edmiston in yacht charter; Royal Delfin in catamaran tours; Submarine Safaris in Lanzarote) have built local positions that are increasingly expensive to displace.
The window for owners to act with strategic flexibility — choosing the position that fits each asset rather than the one that remains available — is narrowing. It is not closed. In most destinations there is still room for a coastal resort to decide which of the four operating models it will adopt and to execute that decision before local consolidation forecloses the option. But the window will close, asset by asset, destination by destination, over the next three to five years.
This is exactly the pattern that played out with branded residences. The early movers captured the locations, the brand premiums and the operating playbooks. The late movers paid more for less. The owners who did nothing watched a structurally available value pool migrate to professionals who understood what was happening while the conversation in most boardrooms was about something else.
The conversation owners need to have with themselves
I write this from the perspective of someone who has sat on both sides of the table — as a CFO inside hotel groups operating assets for owners, and as an advisor working with owners trying to understand what their assets are actually doing. What I see consistently, across geographies and across ownership types, is the same pattern: a marine excursion economy of meaningful scale operating around a coastal asset, a hotel operating that asset competently within its conventional boundaries, and an owner who has never been asked whether the current arrangement is the one they would choose if they were starting fresh.
The asset class is mature. The adjacent asset class is not. That is where the value is currently being created, and where it is currently being captured by someone else. The owners who recognize this and act on it during the next budget cycle will be operating assets that look meaningfully different by the end of the next investment cycle from those operated by owners who continue to treat the adjacent economy as somebody else’s market.
Branded residences taught the industry that the most valuable asset class is sometimes the one sitting next to the one you already own. The marine excursion economy is the next iteration of that lesson. The owners who learned the branded residences lesson early are positioned to learn this one early too. The rest of the industry will follow, as it usually does, three to five years late and at a premium they did not have to pay.











Leave a comment