
Descriptive statistics
Table 2 reports the descriptive statistics of the main variables. The explained variable Supply Chain Efficiency (SCE) has a mean value of 4.582 and a standard deviation of 1.118, which illustrates that there are large differences in inventory turnover across enterprises. The mean value of the core explanatory variable digital transformation (Digital) is 1.738, the minimum and maximum values are 0.000 and 5.236, respectively, indicating that the degree of digital transformation of enterprises in China is still in the preliminary stage of development. The standard deviation is 1.384, which indicates that the degree of digital transformation of enterprises in China is not yet balanced. Moreover, the mean values of Management Capabilities (Management Fee) and External Transaction Costs (Transaction Cost) are 0.073 and 0.077, with maximum values of 0.412 and 0.546, respectively, indicating significant differences in management expense and transaction expense among enterprises. The mean value of Customer Concentration (Customer Top5) is 0.3281, with approximately one-third of sales coming from the top five customers, demonstrating the importance of customer relationships.
Benchmark regression
Table 3 reports the results of the benchmark regression of digital transformation on supply chain efficiency. Only the core explanatory variables are included in column (1) and all control variables are included in column (2). According to the results, the coefficients of Digital are all significantly negative at the 1% level, indicating that the higher the degree of digital transformation, the shorter the inventory turnover period of the enterprise, and thus the higher the supply chain efficiency. What’s more, the inventory turnover period decreases by 1.03 days (\({e}^{0.026}\)) with each percentage point increase in Digital. Meanwhile, enterprises with higher ROA, higher cash flows from operating activities and higher capital investments have relatively higher supply chain efficiency. In conclusion, the empirical results confirm that digital transformation has a significant contribution to supply chain efficiency, and H1 is verified.
Endogeneity test
To avoid the problem of endogeneity, this paper draws on28 to use the instrumental variable method for testing. To be more specific, the mean value of the digital transformation in each province in each year (Digital_mean) is used as the instrumental variable. The reason lies is because the province where the enterprise is located may have different degrees of digitalization, which further affects the supply chain efficiency differently. For instance, a high degree of digital transformation in the province indicates that enterprises in that province pay more attention to digitalization, which causes their supply chain efficiency to be more affected. Table 4 reports the results of the two-stage least squares (2SLS) estimation of the instrumental variable, and the test justifies the instrumental variable. The first stage regression results in column (1) of Table 4 shows that the coefficient of Digital_mean is significantly positive at the 1% level, confirming that the choice of instrumental variable is valid and satisfies the correlation requirement. Therefore, the significant effect of digital transformation on supply chain efficiency still holds after considering the endogeneity issue.
Robustness test
Changing the measurement of digital transformation
Digital technology is an important part of enterprise intangible assets; therefore, digital intangible assets can reflect the overall level of digital transformation. In this paper, the ratio of digital intangible assets to the total amount of intangible assets is used to re-measure the core explanatory variable. The regression results in column (1) of Table 5 shows that the coefficient of the ratio of digital intangible assets (Intangible Asset) is significantly negative at the 5% level, indicating that the impact of digital transformation on supply chain efficiency improvement is robust.
Changing the measurement of supply chain efficiency
Supply chain efficiency also includes the operating cycle in the supply chain’s time dimension (Kojima et al., 2008; Wang et al., 2020). It is the period when enterprise purchases, sales and recovery cash. Based on this, this paper re-measures the explained variable using the natural logarithm of the business cycle (lnOperation). The formula for the operating cycle is prepayment cycle + inventory cycle + accounts receivable cycle. The regression results in column (2) of Table 5 shows that the coefficient of Digital is significantly negative at the 1% level, indicating that the shorter the net operating cycle, the higher the supply chain efficiency. Therefore, the basic conclusion that the digital transformation significantly contributes to the supply chain efficiency is robust.
Higher order fixed effects
The cross-multiplier terms of year (Year) and segment industry (ind) are added to the testing model, and the results are shown in column (3) of Table 5. The coefficients of the cross-multiplier terms are all significantly negative at the 1% level, indicating a robust and reliable conclusion.
Time lag effect test
It takes a certain amount of time for enterprise digitalization construction from input to final use and resulting impact. So, the degree of enterprise digital transformation is regressed one period lagged to verify the time lag. Table 5 column (4) shows that the coefficient of the lagged one period variable L.Digital is significantly negative at the 1% level, which demonstrates that the time lag effect of digital transformation empowering supply chain efficiency is significant.
Reducing sample size
If enterprises do not undergo digital transformation, their impact on supply chain efficiency cannot be detected. By removing the value of zero of digital transformation, the number of observations is reduced to 11,347. Column (5) of Table 5 shows that the coefficient of digital transformation is significantly negative at the 1% level, which suggests that the screened-out data have a significant effect on supply chain efficiency.
In summary, the conclusions of this paper remain robust.
Mediator effect test
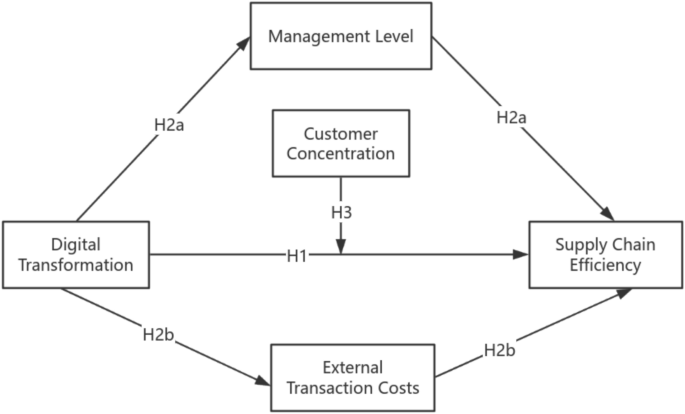
This paper uses management capabilities as the mediating variable. The management capabilities variable is measured by the management expense ratio (Management Fee), which is the ratio of management expenses to operating income. The smaller the value of this indicator, the less the enterprise spends on management and the higher the level of enterprise management. As shown in column (1) and column (2) in Table 6, the coefficients of management capabilities are both significantly negative at the 1% level, meaning that the lower the management expense ratio, the greater the role of digitalization. It is indicated that the digital transformation can improve the supply chain efficiency by reducing the management expenses, optimizing the management process, and improving the overall management capabilities, which is consistent with the expectation of H2a.
In addition to this, this paper also uses external transaction costs as a mediating variable. External transaction costs are measured by the sales expense ratio (Transaction Cost), which is the ratio of sales expenses to operating income. The larger the value of this indicator, the higher the enterprise’s marketing expenditures and the higher the transaction costs. As shown in columns (3) and (4) of Table 6, the coefficients of transaction costs are both significantly positive at the 1% level, meaning that the higher the marketing expense ratio, the greater the effect of digitalization. This suggests that digital transformation can improve supply chain efficiency by increasing marketing expenses, increasing transaction costs, and improving overall marketing, which is consistent with the expectation of H2b.
Moderator effect test
Customer concentration (Customer Top5) is the ratio of the top five customers sales to the annual sales. It reflects the degree of dependence on customers, which implies the measurement of relationship embeddedness29. Therefore, this paper draws on30 to consider the impact of customer concentration on the relationship between digital transformation and supply chain efficiency. The regression results in Table 7 show that the regression coefficient of the cross-multiplier term through digital transformation and customer concentration (Digital*Customer) is 0.001, which is significant positive at the 5% level, indicating that customer concentration plays a negative moderating role in the promotion of digital transformation on supply chain efficiency. In other words, customer concentration reduces the investment in digitalization construction, then inhibits the digital transformation’s impact on supply chain efficiency, which is consistent with the expectation of H3.
Heterogeneity analysis
The degree of digital technology application varies across enterprises, and there are also large differences in supply chain characteristics across industries; therefore, this paper examines whether there are heterogeneous effects of digital technology on supply chain efficiency at the enterprise level and the industry level, respectively. According to the 2012 version of the SEC’s industry classification standards, this paper divides the 19 industry categories into three categories, supply chain-sensitive industries, supply chain-insensitive industries, and other industries. Based on Hypothesis 4, this paper takes the following four industries–-manufacturing + wholesale and retail + transportation + information technology as supply chain-sensitive industries. Apart from that, the supply chain-insensitive industries are four industries–-agriculture, forestry, animal husbandry, fishery + mining + construction + water conservancy, environment, and public facility management. The rest of the industries are other industries. Columns (1)-(3) of Table 8 indicate the results of grouped regressions according to different industries. It is demonstrated that the digital transformation of industries that are supply chain-sensitive are significantly negative at the 1% level, while those supply chain-insensitive industries are not significant. This suggests that supply chain-sensitive industries like manufacturing, wholesale and retail trade, transportation, warehousing and postal services, and information transmission, software and information technology services are more likely to be affected by digital transformation, which facilitates effective integration of digitalization with business operations and further improves their supply chain efficiency, which is consistent with the expectation of H4a.
Additionally, large enterprises usually have stable upstream and downstream channels, they are more capable to ensure that the industrial supply chain is not blocked or interrupted in the face of uncertainty31. Because of that, this paper uses the median enterprise size as the division criterion, samples are divided into large and small enterprises to analyze the heterogeneous impact. Columns (4)-(5) of Table 8 show the results of grouped regressions according to different enterprise sizes. The result shows that the heterogeneity effects of both large and small-sized enterprises are both significantly negative at the 1% level. The coefficients for large enterprises and small enterprises are close, −0.059 and −0.031, respectively. Then the Bootstrap method is used 1,000 times to obtain the “empirical value of p” to test the significance of the coefficient difference between the groups. The empirical p-value obtained by Bootstrap method is 0.000, which is significant at 1% level, indicating that the digital transformation of large enterprises is more effective in improving supply chain efficiency, which is consistent with the expectation of H4b.


Leave a comment