
XAU/USD Current price: $2,916.91
- The United States’ back and froth on tariffs keeps investors on their toes.
- The US will release the February Nonfarm Payrolls report on Friday.
- XAU/USD losing bullish strength, yet sellers remain side-lined.
Spot Gold consolidated in the $2,910 region for most of this Thursday, attracting buyers on an intraday dip to $2,891.27. Financial markets kept swinging at the pace of sentiment, with prevalent demand for safety maintaining the bright metal afloat.
Concerns revolve around United States (US) government tariff plans. President Donald Trump kick-started his mandate by announcing massive levies on most trading partners, rolling 25% taxes on Canadian and Mexican imports on Tuesday, only to delay such levies on automakers for one month on Wednesday.
Additionally, Trump said on Thursday, “After speaking with President Claudia Sheinbaum of Mexico, I have agreed that Mexico will not be required to pay Tariffs on anything that falls under the USMCA Agreement. This Agreement is until April 2nd. I did this as an accommodation and out of respect for President Sheinbaum. “
The back and forth does not overshadow the fact that the trade war is in full fashion, and hence, concerns about the economic performance of the world’s largest economy. Speculative interest considers that Trump’s plans pose a downward risk to growth and an upward risk to inflation, resulting in a weakening Greenback.
Meanwhile, US employment-related data came in mixed. On the one hand, weekly unemployment claims fell in the last week of February, while Q4 Unit Labor Costs declined to 2.2% from 3% in the previous quarter. On the other hand, US-based employers last month announced plans to slash 172,017 jobs, a 103% increase from January and the highest February total since 2009, according to the Challenger Job Cuts report.
The US will release the February Nonfarm Payrolls report on Friday. The country is expected to have added 160K new jobs in the month, while the Unemployment Rate is foreseen steady at 4%.
XAU/USD short-term technical outlook
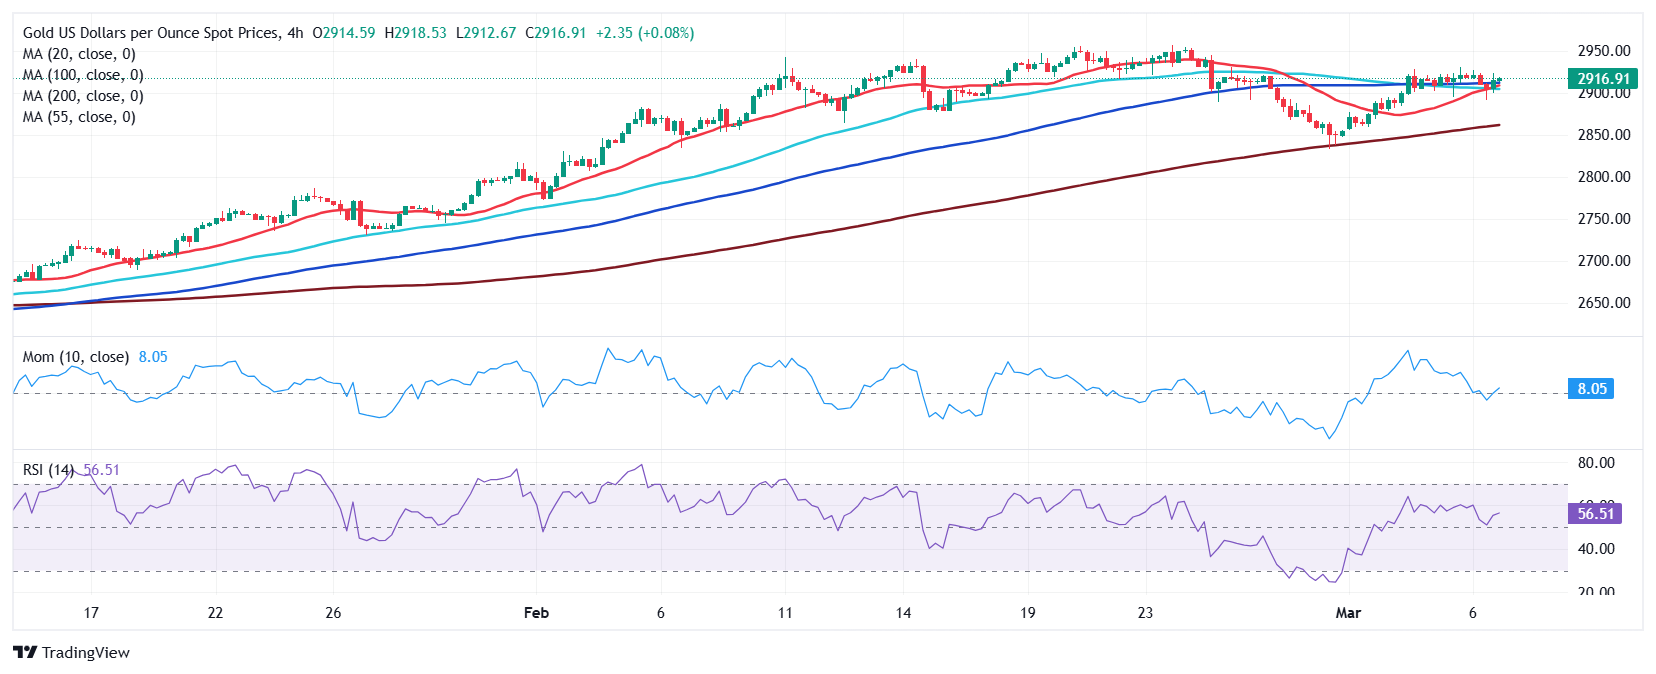
The daily chart for the XAU/USD pair shows is little changed for a second consecutive day, yet at the same time, it posted a lower high and a lower low, which skews the risk to the downside. However, the same chart shows that intraday dips below a bullish 20 Simple Moving Average (SMA) quickly attract buyers. Technical indicators, in the meantime, remain within positive levels, although with uneven strength.
The near-term picture shows buyers battling to retain control. The XAU/USD pair is currently developing above all its moving averages, although a flat 100 SMA stands at $2,911.50. The 20 SMA, in the meantime, advances below the longer one. Finally, technical indicators diverge around their midlines, with the Momentum indicator aiming lower yet the Relative Strength Index (RSI) advancing. The bearish potential remains limited, with dips likely to keep attracting buyers.
Support levels: 2,911.50 2,894.25 2,876.90
Resistance levels: 2,927.90 2,941.40 2,956.10