

Gold has a reputation as an inflation hedge, but the nuance matters: it doesn’t outperform in every inflationary environment. It excels specifically in the type of inflation the market is experiencing right now that is supply-shock-driven, geopolitically sourced, and resistant to the monetary policy tools central banks typically use to stamp it out.
When inflation comes from demand — consumers spending too much — the Fed raises rates, borrowing costs go up, spending cools, and inflation fades. Gold performs modestly in that scenario because higher rates raise the opportunity cost of holding a non-yielding asset. But when inflation comes from supply disruptions — oil blockades, memory chip shortages, food supply constraints — rate hikes can’t fix the underlying problem. Gold historically thrives in that environment because it stands outside every supply chain entirely. You can’t shortage it. You can’t blockade it. You can’t manufacture more of it to solve a demand problem.
That is 2026’s inflation story. And it makes the case for gold ETFs more compelling than it has been in years.
Why Gold Works as an Inflation Hedge — and When It Doesn’t
Gold’s inflation-hedging properties work through three distinct channels, all of which are active in the current environment:
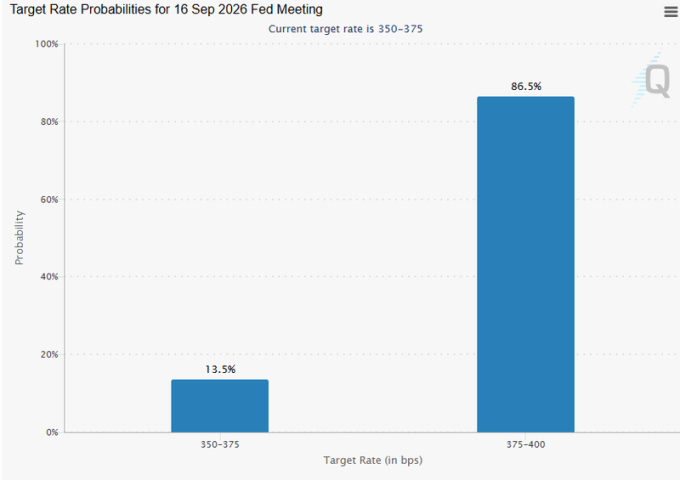
Real interest rates. Gold tends to perform best when real interest rates — nominal rates minus inflation — are low or negative. The Fed continues holding rates steady at 3.5-3.75%. Although June inflation dipped to 3.5% on easing gas prices, geopolitical developments in July are likely to send real rates negative for many savers as oil prices climb once more. Negative real rates mean money in cash is losing purchasing power every day, which makes gold’s zero yield look relatively attractive.
Currency debasement. Persistent inflation erodes the purchasing power of the dollar. Gold is priced in dollars but is not a dollar — it’s a global asset with a fixed supply. When investors lose confidence that the Fed can contain inflation without triggering a recession, gold benefits from demand as a currency alternative.
Geopolitical uncertainty. Military escalation in the Middle East, disruptions to the Strait of Hormuz, and a global AI infrastructure race that is creating new supply dependencies have all elevated geopolitical risk in 2026. Gold is the oldest safe-haven asset in the world, and elevated geopolitical uncertainty is one of its strongest demand drivers.
Gold’s 2026 Performance — and Why It May Have More Room to Run
Gold is actually down roughly 7% year-to-date in 2026 — physical gold ETFs like IAU show a NAV total return of -7.29% as of mid-July, even though CPI is running at 3.5% and energy prices are up over 20%. That’s a meaningful disconnect: gold has been falling even as the inflationary backdrop that typically supports it has intensified, which complicates the simple inflation-hedge narrative.
In past high-inflation cycles, gold’s big moves have often come with a delay. The metal spent much of 2021 flat while inflation was building, then surged in 2022 as the inflation narrative became impossible to dismiss. The pattern in 2026 has diverged from that setup so far: rather than a delayed catch-up rally, gold has actually pulled back even as inflation data has stayed consistently hotter than expected for several consecutive months.
For ETF investors, the implication is less straightforward than the macro backdrop alone suggests: the inflation environment supports the case for gold, but 2026’s price action has not yet confirmed the inflation-hedging thesis in practice. The question is which gold ETF is the right vehicle.
The Best Gold ETFs for 2026
GLDM — SPDR Gold MiniShares Trust
For long-term investors who want the most cost-efficient gold exposure, GLDM is the best option available. With an expense ratio of just 0.10%, GLDM is the lowest-cost physically-backed gold ETF in the U.S. market. It holds actual gold bars in JPMorgan Chase Bank, N.A. vaults in London, and each share represents a fractional interest in that physical gold. The lower share price compared to GLD also makes it more accessible for smaller investors and for dollar-cost averaging strategies. For most buy-and-hold investors, GLDM is the starting point for gold exposure in a portfolio.
IAU — iShares Gold Trust
IAU is iShares’ flagship gold ETF, with roughly $60 billion in assets and an expense ratio of 0.25% — slightly higher than GLDM but still dramatically cheaper than GLD. It tracks the same gold price and holds physical gold, making it functionally equivalent to GLDM for long-term holder, while holding more gold per share than GLDM. IAU has slightly more liquidity than GLDM and a longer track record, which can matter for larger institutional-scale positions. Either IAU or GLDM is an excellent choice for core gold allocation; the decision largely comes down to which brokerage platform offers commission-free trading for each.
GLD — SPDR Gold Shares
GLD is the original gold ETF, launched in 2004, and offers the most gold per share ownership. It remains the largest and most liquid gold fund in the world with over $130 billion in assets. Its daily trading volume and deep options market make it the vehicle of choice for institutional investors, short-term traders, and anyone who wants to use options strategies on gold — protective puts, covered calls, collars. The expense ratio of 0.40% is higher than both GLDM and IAU, meaning it is not the most efficient choice for simple long-term gold exposure. But for anyone who values liquidity above all else, or who plans to use the options market, GLD remains the gold standard (literally) in gold ETFs.
SGOL — abrdn Physical Gold Shares ETF
SGOL holds physical gold stored in vaults in the U.K. With an expense ratio of 0.17%, SGOL sits between GLDM and IAU on cost. It is a smaller fund (~$6B AUM) with lower daily liquidity than GLD or IAU, but provides another low-cost entry point for buy-and-hold investors.
GDX — VanEck Gold Miners ETF
GDX is not a gold ETF in the direct sense — it holds the stocks of gold mining companies rather than physical gold. But it belongs in this conversation because gold miners traditionally generate leveraged exposure gold price. When gold rises, gold mining company earnings rise faster than the gold price itself, because miners’ production costs are largely fixed. A 10% rise in gold can translate to 20–30% earnings growth for a well-run miner.
With approximately $22 billion in AUM, GDX is the most liquid gold equity ETF. Its top holdings include Newmont, Agnico Eagle, Barrick Mining, and Wheaton Precious Metals — the world’s largest publicly traded gold producers. For investors who believe gold is undervalued relative to current inflation (or will be, should inflation climb once more) and want amplified upside, GDX is the vehicle. The trade-off: GDX is significantly more volatile than physical gold ETFs, and it introduces equity risk (management quality, mine operations, hedging decisions) on top of gold price exposure.
GDXJ — VanEck Junior Gold Miners ETF
GDXJ takes the leverage concept further by focusing on smaller, earlier-stage gold mining and royalty companies. Junior miners have even more operating leverage to gold prices than majors — when gold is rising strongly, the best junior miners can see outsized gains. But the volatility and downside risk are correspondingly higher. GDXJ is appropriate for investors with a high risk tolerance who want maximum upside participation in a gold bull market. It is not appropriate as a simple inflation hedge for conservative portfolios.
Physical Gold ETFs vs. Gold Miners: Which Is Right for You?
The choice between physical gold ETFs (GLD, IAU, GLDM, SGOL) and gold miner ETFs (GDX, GDXJ) comes down to what you want the position to do in your portfolio.
If the goal is inflation hedging and capital preservation — protecting purchasing power against high CPI readings — physical gold ETFs are the right choice. They track the gold price directly, carry no equity risk, and are as close to a pure commodity hold as an ETF investor can get.
If the goal is inflation-driven capital appreciation — making money because you believe gold is going higher from here — GDX adds equity leverage that can amplify returns in a gold bull market. The risk is commensurately higher.
Most investors building an inflation-resilient portfolio should start with a physical gold ETF (GLDM for cost efficiency, GLD if they want options flexibility) and only add GDX if they have a specific view on gold prices running significantly higher and can tolerate the additional volatility.
How Much Gold Should an Inflation Hedge Portfolio Carry?
Traditional portfolio construction guidance suggests a 5–10% gold allocation for investors seeking inflation protection and portfolio diversification. In the current environment with inflation running still running well above the Fed’s 3% mandate, and geopolitical risk elevated, there is a case to be made for being toward the higher end of that range.
A practical allocation for an inflation-focused portfolio might look like: GLDM or IAU at 7–10% of the portfolio, combined with short-duration instruments (SGOV, VTIP) and energy exposure (XLE or PDBC) for a multi-channel inflation hedge. Gold alone does not hedge every inflationary scenario — it is strongest against supply-shock and geopolitical inflation, which is exactly what 2026 is delivering, but less reliable as a hedge against demand-pull inflation where rate hikes are effective.
Gold ETFs are not always the right inflation trade, but 2026’s supply-shock, geopolitically-driven inflation is the specific environment they were built for. With CPI and PPI high, volatile and soaring energy prices, and ongoing geopolitical strife, the macro backdrop for gold is as supportive as it has been since the post-pandemic inflation surge.
For most investors, the starting point is simple: GLDM for maximum cost efficiency, IAU as a liquid alternative, or GLD if you want options market access. Add GDX if you want leveraged upside exposure through gold mining equities — but understand you’re taking on equity risk alongside commodity risk.
Gold has actually been down roughly 7% YTD in 2026, based on IAU‘s -6.35% NAV total return as of mid-July. Given the macro backdrop, whether that reverses by year-end remains to be seen.
This article was generated with the assistance of artificial intelligence and reviewed by ETF.com staff.
Investment Risk Disclosure
The information provided on this website is for informational and educational purposes only and does not constitute investment advice, financial advice, trading advice, or any other sort of advice. Nothing on this site should be construed as a recommendation to buy, sell, or hold any security or financial product.
General Investment Risks
Investing involves risk, including the possible loss of principal. Past performance is not indicative of future results. The value of investments may fluctuate, and investors may receive back less than they originally invested. There is no guarantee that any investment strategy will achieve its objectives.
ETF-Specific Risks
Exchange-traded funds (ETFs) are subject to risks similar to those of stocks and other equity securities. ETF shares are bought and sold at market price, which may differ from the fund’s net asset value (NAV). Brokerage commissions may apply and will reduce returns. ETFs may be subject to the following additional risks:
Market Risk: The value of an ETF may decline due to broad market fluctuations unrelated to the underlying securities.
Liquidity Risk: Some ETFs may have limited trading volume, which could make it difficult to buy or sell shares at a desired price.
Tracking Error Risk: An ETF may not perfectly replicate the performance of its benchmark index.
Concentration Risk: Sector or thematic ETFs may be concentrated in a particular industry or geography, increasing volatility.
Currency Risk: ETFs that invest in international securities may be affected by exchange rate fluctuations.
Leverage and Inverse Risk: Leveraged and inverse ETFs are designed for short-term trading and may not be suitable for long-term investors. These products use derivatives and may experience significant losses.
No Warranty
While efforts are made to ensure the accuracy of information presented, no warranties are made regarding completeness, accuracy, or timeliness. Information may change without notice.
Not a Fiduciary
This site does not act as a fiduciary on behalf of any user. Users are encouraged to consult with a registered investment advisor, financial planner, or other qualified professional before making any investment decisions.












Leave a comment