 Latest Stock Performance A Reflection Of Its Financial Health?")
Most readers would already be aware that NCT Alliance Berhad’s (KLSE:NCT) stock increased significantly by 31% over the past month. Given the company’s impressive performance, we decided to study its financial indicators more closely as a company’s financial health over the long-term usually dictates market outcomes. In this article, we decided to focus on NCT Alliance Berhad’s ROE.
Return on equity or ROE is an important factor to be considered by a shareholder because it tells them how effectively their capital is being reinvested. In short, ROE shows the profit each dollar generates with respect to its shareholder investments.
View our latest analysis for NCT Alliance Berhad
How Is ROE Calculated?
ROE can be calculated by using the formula:
Return on Equity = Net Profit (from continuing operations) ÷ Shareholders’ Equity
So, based on the above formula, the ROE for NCT Alliance Berhad is:
6.2% = RM38m ÷ RM610m (Based on the trailing twelve months to December 2023).
The ‘return’ refers to a company’s earnings over the last year. One way to conceptualize this is that for each MYR1 of shareholders’ capital it has, the company made MYR0.06 in profit.
What Is The Relationship Between ROE And Earnings Growth?
We have already established that ROE serves as an efficient profit-generating gauge for a company’s future earnings. Based on how much of its profits the company chooses to reinvest or “retain”, we are then able to evaluate a company’s future ability to generate profits. Assuming all else is equal, companies that have both a higher return on equity and higher profit retention are usually the ones that have a higher growth rate when compared to companies that don’t have the same features.
NCT Alliance Berhad’s Earnings Growth And 6.2% ROE
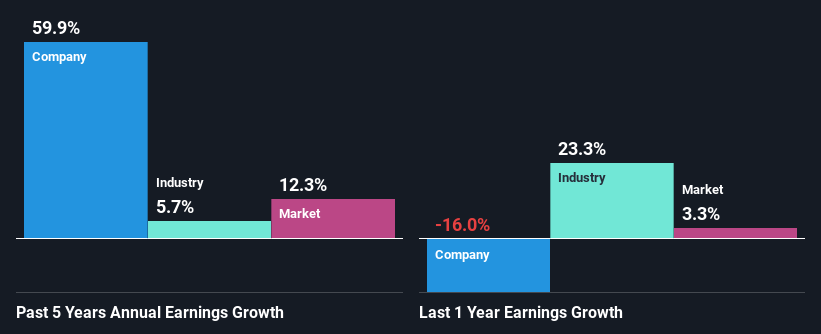
At first glance, NCT Alliance Berhad’s ROE doesn’t look very promising. However, the fact that the company’s ROE is higher than the average industry ROE of 4.2%, is definitely interesting. Especially when you consider NCT Alliance Berhad’s exceptional 60% net income growth over the past five years. That being said, the company does have a slightly low ROE to begin with, just that it is higher than the industry average. So, there might well be other reasons for the earnings to grow. Such as- high earnings retention or the company belonging to a high growth industry.
As a next step, we compared NCT Alliance Berhad’s net income growth with the industry, and pleasingly, we found that the growth seen by the company is higher than the average industry growth of 5.7%.
Earnings growth is a huge factor in stock valuation. The investor should try to establish if the expected growth or decline in earnings, whichever the case may be, is priced in. By doing so, they will have an idea if the stock is headed into clear blue waters or if swampy waters await. If you’re wondering about NCT Alliance Berhad’s’s valuation, check out this gauge of its price-to-earnings ratio, as compared to its industry.
Is NCT Alliance Berhad Making Efficient Use Of Its Profits?
NCT Alliance Berhad doesn’t pay any dividend currently which essentially means that it has been reinvesting all of its profits into the business. This definitely contributes to the high earnings growth number that we discussed above.
Summary
In total, we are pretty happy with NCT Alliance Berhad’s performance. Particularly, we like that the company is reinvesting heavily into its business at a moderate rate of return. Unsurprisingly, this has led to an impressive earnings growth. If the company continues to grow its earnings the way it has, that could have a positive impact on its share price given how earnings per share influence long-term share prices. Remember, the price of a stock is also dependent on the perceived risk. Therefore investors must keep themselves informed about the risks involved before investing in any company. To know the 1 risk we have identified for NCT Alliance Berhad visit our risks dashboard for free.
Have feedback on this article? Concerned about the content? Get in touch with us directly. Alternatively, email editorial-team (at) simplywallst.com.
This article by Simply Wall St is general in nature. We provide commentary based on historical data and analyst forecasts only using an unbiased methodology and our articles are not intended to be financial advice. It does not constitute a recommendation to buy or sell any stock, and does not take account of your objectives, or your financial situation. We aim to bring you long-term focused analysis driven by fundamental data. Note that our analysis may not factor in the latest price-sensitive company announcements or qualitative material. Simply Wall St has no position in any stocks mentioned.