
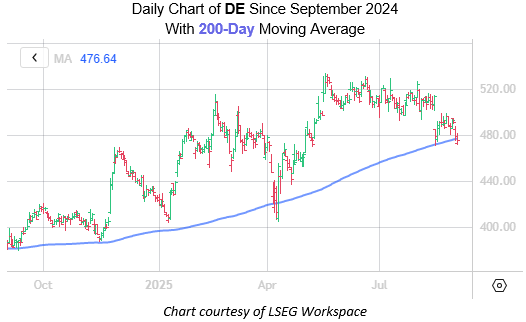
Machinery stock Deere & Co (NYSE:DE) has been struggling to recover from its mid-August post-earnings bear gap of 6.8%, which pushed it further from its May 16 record high of $533.78. Deere has also been in the spotlight amid Trump tariffs, with today’s federal appeals court news worth watching, as well as the stock’s recent pullback, which is testing a historically bullish trendline.
Per Schaeffer’s Senior Quantitative Analyst Rocky White, DE is within 0.75 of the 200-day trendline’s 20-day average true range (ATR), after spending at least 80% of the last 10 days and 80% of the last two months above it. This has happened five other times over the past three years, after which the equity was higher one month later 60% of the time, averaging a 6.5% gain. A move of similar magnitude from the stock’s current perch at $475.39 would put it at $506.29, erasing most of its August slide.

When weighing in on Deere stock’s next move, options look like a good way to go. Options traders are pricing in low volatility expectations at the moment, per DE’s Schaeffer’s Volatility Index (SVI) of 22%, which ranks in the low 9th percentile of its annual range.


Leave a comment