
The Reserve Bank of India (RBI) recently undertook operations to manage the liquidity generated by the FCNR(B) deposit mobilisation and associated foreign exchange swaps. It used variable rate reverse repo (VRRR) auctions to absorb liquidity temporarily and subsequently supplemented the auctions with open market operations (OMO) sales for durable absorption.
A VRRR auction is a monetary policy tool the RBI uses to absorb excess funds from the banking system for a specific duration, ensuring short-term, overnight money market rates align with the benchmark policy repo rate.
The central bank uses OMOs to drain rupee liquidity from the banking system for a longer duration or permanently by selling government securities. Conversely, OMO purchases inject liquidity.
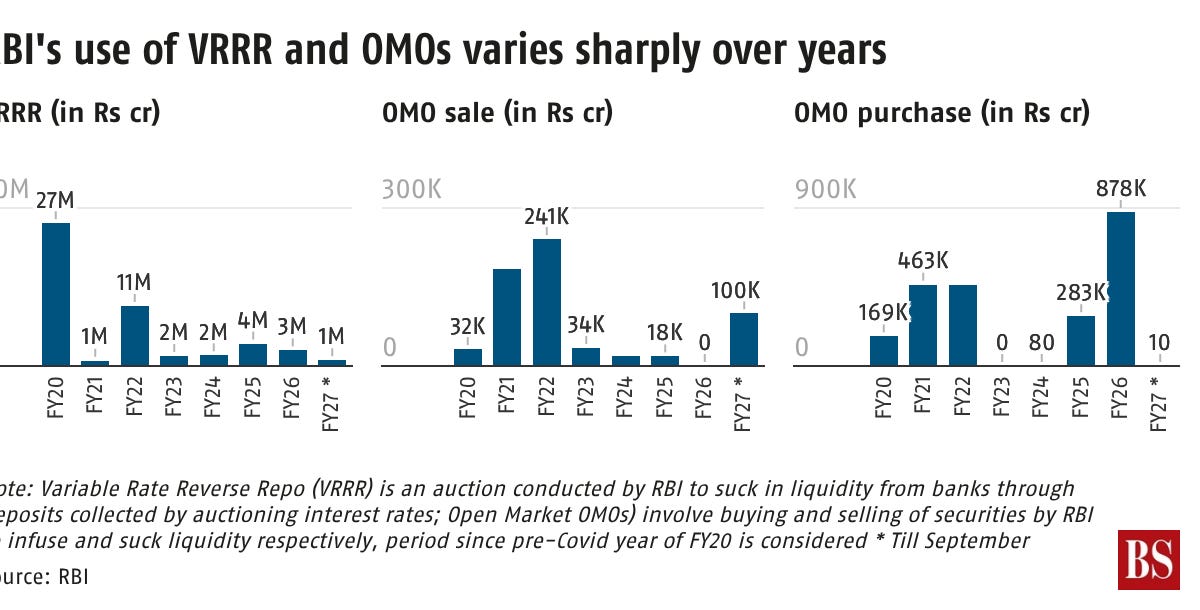
Data on liquidity-management operations for several years show that the RBI has used VRRR operations much more frequently than either OMO sales or purchases. This means that the central bank relied more on short-term tools to manage liquidity.
FY20 had the highest number of VRRR operations in the past seven and a half years. FY25 saw the highest number of VRRR operations in the post-pandemic period. OMO sales were used most frequently in FY23, whereas OMO purchases were most frequent in FY21.
However, in value terms, frequency does not necessarily correspond to the amount of liquidity absorbed or injected. FY22 recorded the highest cumulative VRRR value as well as the highest OMO-sale value, while FY26 recorded the highest OMO-purchase value. The current FY27 exercise, with 10 VRRR operations so far, therefore needs to be viewed against this historical variation in both the frequency and size of the RBI’s liquidity operations.
Post-pandemic, the RBI conducted an average of about 43 VRRR operations a year, compared with about 37 OMO-sale operations and 31 OMO-purchase operations annually over FY21-FY26. VRRR activity peaked in frequency in FY25, while OMO sales peaked in FY23 and OMO purchases in FY21. In terms of value, FY22 was the standout year for liquidity absorption through both VRRR and OMO sales, whereas FY26 was the standout year for OMO purchases. (Chart 1)
RBI’s use of VRRR and OMOs varies sharply over years
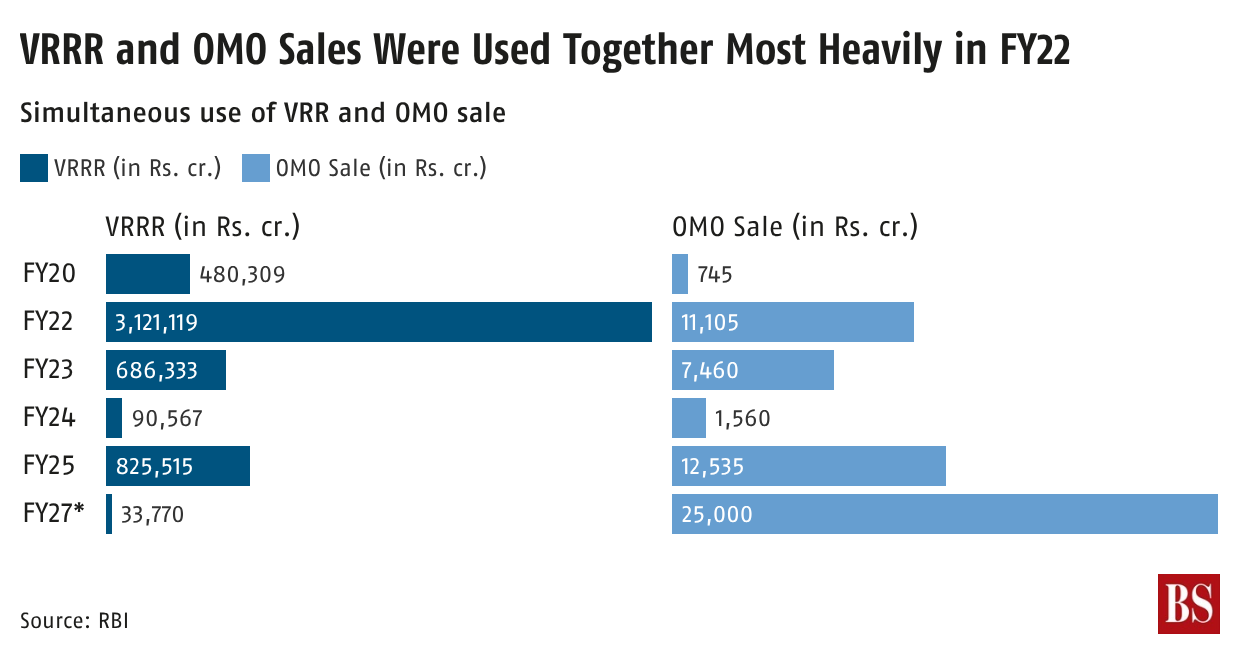
The RBI used VRRR operations simultaneously with OMO sales to absorb liquidity for short and long durations. It did this in six out of the past seven and a half years. The central bank did not rely on simultaneous use of these instruments during the pandemic-hit year of FY21 or FY26. The highest amount of liquidity was absorbed during FY22, which coincided with the second wave of Covid-19. (Chart 2)
VRRR and OMO Sales Were Used Together Most Heavily in FY22
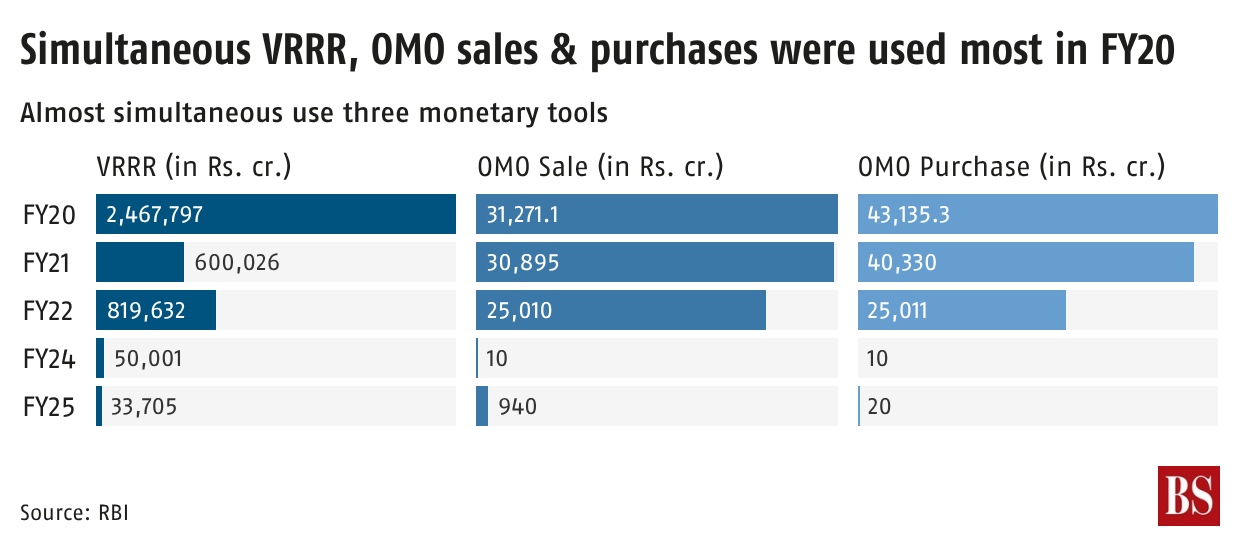
The RBI used all three instruments in the same year in five of the past seven and a half years. It sucked in the highest amount of liquidity from the system in the pre-pandemic year of FY20. However, that year also saw a higher amount of liquidity injection than absorption for longer durations. FY22 witnessed an almost equal amount of liquidity injection and absorption for longer durations. That year also saw the second highest absorption of liquidity for shorter periods in the past seven and a half years. (Chart 3)
Simultaneous VRRR,OMO sales & purchases were used most in FY20
This shows the RBI avoids relying on any single tool. Instead, it adjusts the scale and frequency of VRRR, OMO sales, and OMO purchases to suit its goals — whether absorbing liquidity temporarily, draining it for the longer term, or injecting fresh funds into the banking system.











Leave a comment