
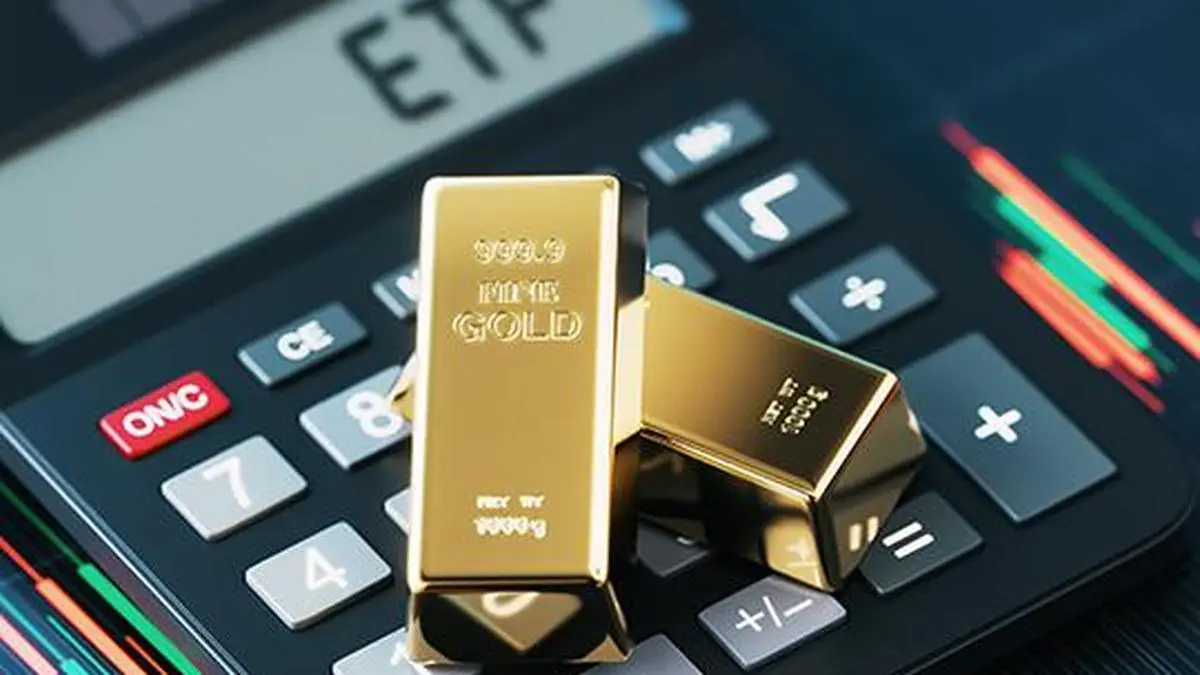

Calculator Displaying ETF With Gold Bars On Keys Over Financial Chart Background.
| Photo Credit:
mustafaU
Investments in physically backed gold exchange-traded funds (ETFs) were positive for the tenth week in a row last week, but outflows almost matched the inflows, data from the World Gold Council (WGC) showed.
Data showed that while US investors led the exits from ETFs, UK investors led the inflows, though they tended to be cautious in general. While $1.72 billion was invested in gold ETFs last week, redemptions were to the tune of $1.59 billion.
The trend follows an over 6 per cent fall in the price of the yellow metal in the past month and an over 4 per cent decline in the past week. On Monday, gold was down 3 per cent to around $4,150 an ounce.

Punishing week
“Gold had a punishing week, with spot gold down about 2 per cent. The pressure came from rates, not fading haven appeal: a firmer dollar, 10-year Treasury yields near 5.50 per cent and a hot flash PMI raising bets on another Fed hike in October,” said Prithiviraj Kothari, Managing Director at RiddiSiddhi Bullions Ltd and President of the India Bullion and Jewellers Association Ltd.
“Gold will remain sensitive to US economic data, Fed expectations, the dollar and geopolitical developments, while the festive and wedding season should provide some support to domestic demand,” said Darshan Desai, CEO, Aspect Bullion & Refinery.
Last week, US investors redeemed $683 million, while the British invested $438 million. Others who invested were Chinese ($81 million), Canadians ($72.8 million), Swiss ($64.9 million), Germans ($58.5 million) and French ($48.8 million). Data for India was not available.
EU, Asians at par
Year-to-date, net investments by Europeans and Asians were almost at par, at $16.56 million each. Country-wise, investors in the UK ($9.40 billion) edged ahead of those in China ($9.33 billion), followed by Indians at $4.21 billion.
Inflows from the US were $3.68 billion, from Switzerland $3.26 billion, Germany $1.98 billion, France $1.91 billion and Hong Kong Special Administrative Region $1.01 billion.
A slew of data, such as US labour, inflation, employment, the PCE price index and non-farm payrolls, could decide the direction of gold, said Renisha Chainani, head of research at Augmont. “The near-term picture hinges on US inflation, Fed speakers and any breakthrough or breakdown in Iran talks.
Down 3% YTD
After soaring to a record high of $5,608 an ounce on January 29, the yellow metal has given up all the gains made this year. It is 3 per cent lower year-to-date. The precious metal began to shed its gains after the Iran war broke out on February 28.
Fears of inflation and the global economy, rising treasury yields, hopes of high interest rates and investors switching over to the crude counter from gold have pulled gold by over 25 per cent since January 29.
Since 2024, gold has had a dazzling run on hopes of a cut in interest rates, geopolitical tensions and the US trade disputes with other countries.
Published on September 28, 2026












Leave a comment