
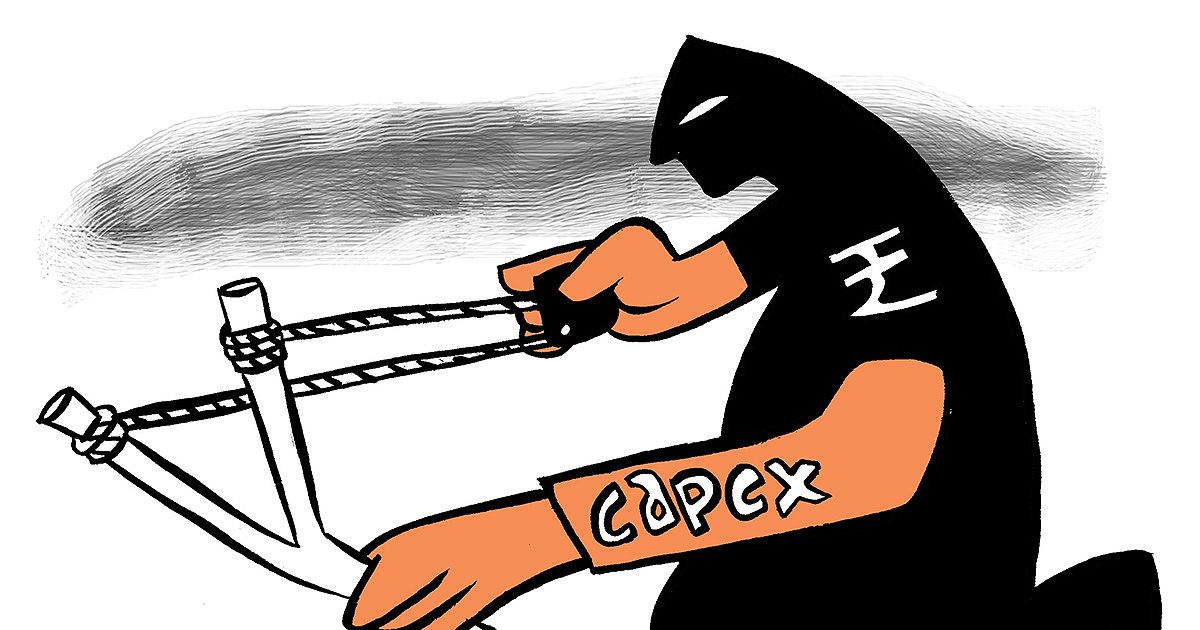
India’s private sector capital expenditure surged by 7 per cent to Rs 30.3 trillion in FY25, driving overall investment growth despite a moderation in government spending, as revealed by the latest statistics ministry data.

Illustration: Uttam Ghosh
Key Points
- Private corporations’ capital expenditure increased by 7 per cent to Rs 30.3 trillion in FY25, indicating healthy investment growth.
- Government capital spending moderated to 10.2 per cent in FY25 from 18.5 per cent in FY24, primarily due to states managing fiscal deficits.
- Total investments in fixed assets reached approximately Rs 99.76 trillion in FY25, with overall investment growth at 8.2 per cent.
- Machinery and equipment constituted nearly half of corporate investment, with growth rebounding to about 6 per cent.
- Household capital expenditure, predominantly in dwellings and structures, remained the largest investor, accounting for 43.7 per cent of total fixed assets.
Private corporations invested Rs 30.3 trillion in fixed assets such as plant, machinery and intellectual property in FY25, a 7 per cent jump from the capital expenditure they made in the previous year, establishing a healthy growth in investments, according to the latest data available from the statistics ministry.
In FY24, they had made a capital expenditure of Rs 28.3 trillion, showing an annual growth of 2.65 per cent, as per the detailed Gross Fixed Capital Formation (GFCF) figures for FY25 released by the ministry.
Public vs. Private Investment Trends
On the other hand, government capital spending slowed to 10.2 per cent in FY25 from 18.5 per cent in FY24, while total investment growth held at 8.2 per cent in FY25 compared to 9 per cent in year ago period.
Total investments in fixed assets stood at Rs 99.76 trillion in FY25.
“Capital expenditure of state governments has actually moderated to manage the fiscal deficits,” according to Madan Sabnavis, chief economist at Bank of Baroda.
He said that the slowdown in public investment reflected a step by states to rein in their finances and keep deficit in check.
Composition of Corporate and Household Investments
Machinery and equipment is the single largest slice of corporate investment at nearly half the total, with growth rebounding to about 6 per cent from barely 1 per cent a year earlier.
This was followed by spending on dwellings, buildings and structures, while intellectual property products also trailed closely.
Sabnavis reckoned that the corporate investment revival, however, is narrow and not broad-based.
He said the FY25 expansion was in line with his expectations, but stressed that the pickup is concentrated among infrastructure-linked firms rather than spread across industry.
The shift, however, leaves the broader structure intact.
Private non-financial corporations still accounted for 30.4 per cent of the roughly Rs 99.76 trillion India poured into fixed assets during the year.
The single largest investor, as it has been before, was the Indian household — forming 43.7 per cent of the total.
Public non-financial corporations and the general government together formed about 24.2 per cent of the total GFCF.
Household Spending Dominates Fixed Asset Formation
Household capital expenditure refers to the investments made by individual households and unincorporated micro-enterprises in long-term physical assets.
And what households invest in is, overwhelmingly, bricks and mortar.
Close to three-quarters of household investment — nearly Rs 33 trillion — went into dwellings, buildings and other structures.
That one stream is the largest in the entire economy, and it anchors a broader construction boom: buildings and structures of every kind, from housing to highways, made up 58.8 per cent of India’s fixed investment in FY25.
Seen by type of asset, the rest of the picture falls into place.
Machinery and equipment accounted for a further 30.6 per cent of the total, and intellectual property products for 10.4 per cent — leaving about 0.2 per cent, in cultivated biological resources such as orchards, plantations and livestock.












Leave a comment