
Key Takeaways
- The asset coverage ratio measures a company’s ability to repay debts by liquidating assets.
- A higher asset coverage ratio indicates lower risk for creditors and investors.
- This ratio is crucial for assessing a company’s solvency and financial health.
- It’s important to compare the ratio with industry peers for meaningful insights.
- The ratio may appear inflated due to book value discrepancies in asset valuation.
What Is the Asset Coverage Ratio?
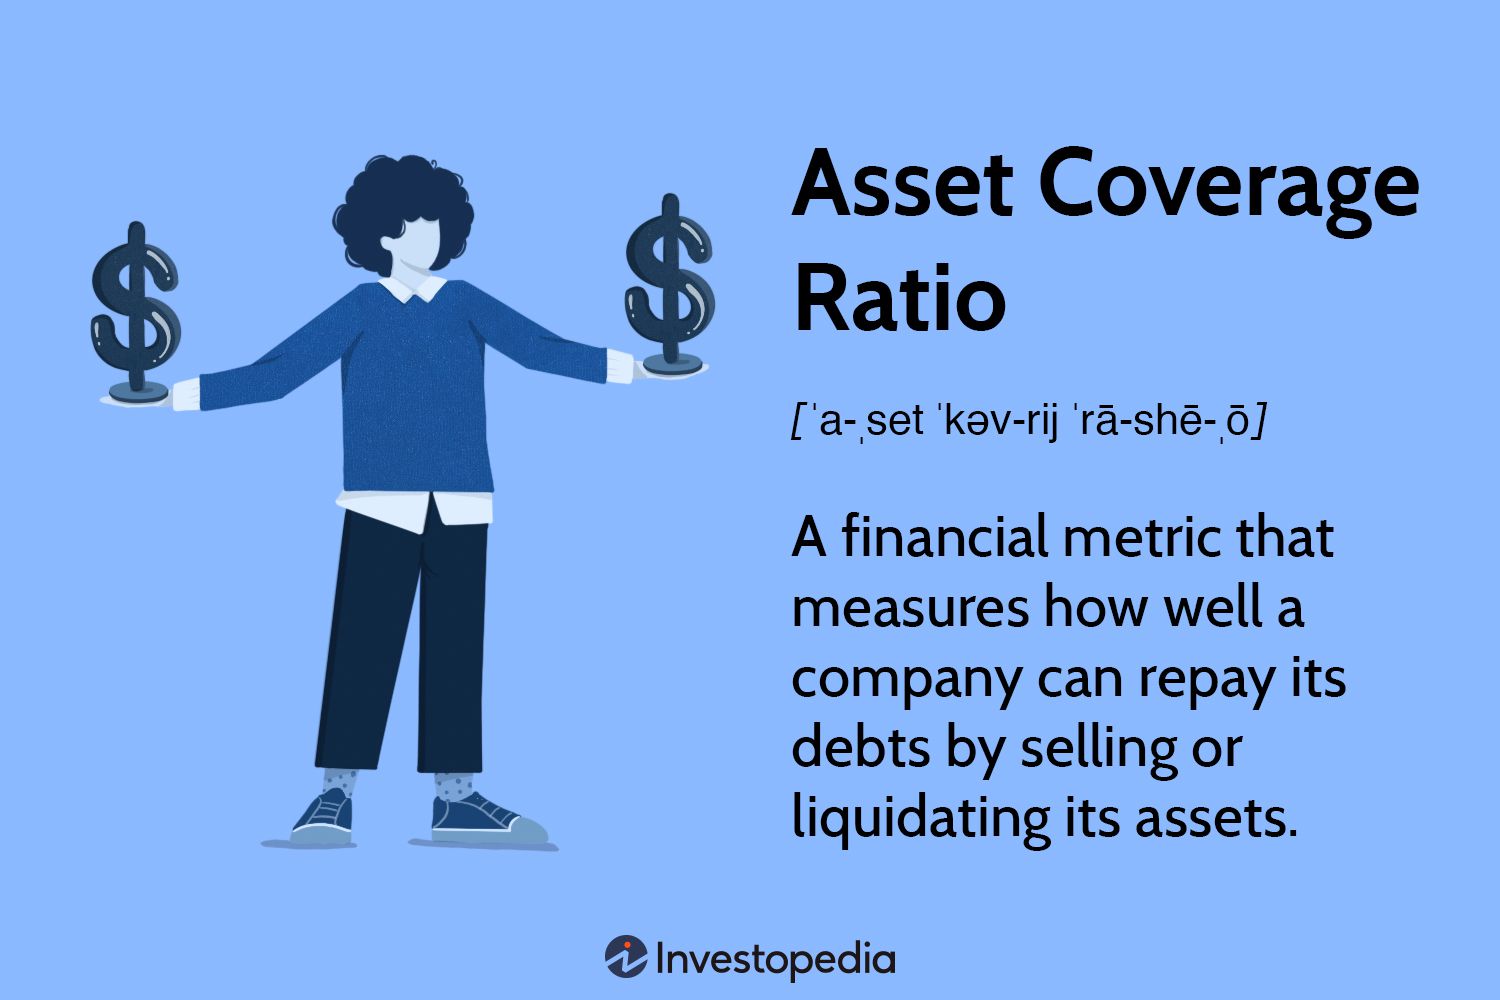
The asset coverage ratio measures how well a company can repay its debts by selling or liquidating its assets. It is a key financial metric that helps lenders, investors, and analysts measure a company’s financial solvency and compare it to other companies in the same industry.
A higher asset coverage ratio generally indicates that the company has more than enough assets to cover its debt, making it less risky to lenders. A lower ratio suggests that it may face difficulty paying its debt.
Asset coverage ratios tend to vary by industry, since some business sectors need to borrow more capital than others. Banks and creditors often consider a minimum asset coverage ratio before lending money.
How to Interpret the Asset Coverage Ratio for Financial Analysis
The asset coverage ratio allows creditors and investors to gauge the level of risk associated with investing in a company. Once the coverage ratio is calculated, it can be compared to the ratios of companies within the same industry or sector, helping to determine whether a company carries a manageable debt level compared to its peers.
Comparing the ratio across different industries is less reliable. Companies within certain industries may typically carry more debt on their balance sheets than those in other industries.
For example, companies in the tech sector, like Microsoft and Meta, generally operate with relatively low debt levels compared to their market capitalization, due to the nature of their business. In contrast, companies in capital-intensive industries, such as ExxonMobil in the oil and gas industry, often carry higher debt levels to finance expensive equipment like oil rigs. Exxon ended 2025 with $34.24 billion in long-term debt. Even with higher debts, ExxonMobil’s substantial assets help it maintain a healthy coverage ratio.
Calculating the Asset Coverage Ratio
The asset coverage ratio is calculated with the following equation:
Total Debt(Total Assets−Intangible Assets)−(Current Liabilities−Short-term Debt)
Here’s how the formula breaks down:
-
Total assets refer to all the assets a company owns.
-
Intangible assets are assets that can’t be physically touched, such as goodwill, patents, or trademarks.
-
Current liabilities are liabilities due within one year.
-
Short-term debt is debt that is also due within one year.
-
Total debt includes both short-term and long-term debt.
Important
All of the above components can be found in a company’s annual report, on its balance sheet.
Utilizing the Asset Coverage Ratio in Investment Decisions
Companies that issue shares of stock or equity to raise funds don’t have a financial obligation to pay those funds back to investors. However, when companies issue debt through bonds or borrow from banks, they must make regular payments and eventually repay the principal.
Thus, banks and investors need to know if a company’s earnings can cover debt and the implications if they can’t.
The asset coverage ratio is a key solvency ratio that addresses this concern. It measures how well a company can cover its short-term debt obligations using its assets, especially when earnings may not suffice.
A higher ratio shows a company can cover its debts multiple times, reducing risk for lenders.
If earnings fall short, then the company may need to sell assets to generate cash. The asset coverage ratio tells creditors and investors how often the company’s assets can cover its debts if earnings are insufficient to cover debt payments.
The asset coverage ratio is more extreme than the debt service ratio, as it reflects the company’s ability to cover its debts by liquidating assets. This scenario represents a last resort, typically used only in financial distress situations.
Important Considerations When Analyzing the Asset Coverage Ratio
There’s one caveat to consider when interpreting the asset coverage ratio. Balance sheet assets are listed at book value, often higher than their selling value during liquidation.
Hence, the ratio may be slightly inflated, showing a more favorable but unrealistic view of debt coverage ability. This is why it’s important to compare the asset coverage ratio with other companies within the same industry.
Example: Asset Coverage Ratio in Practice
Let’s say, for example, that ExxonMobil Corp. (XOM) has an asset coverage ratio of 1.5, indicating it has 1.5 times more assets than debts. Let’s say Chevron Corp. (CVX)—within the same industry as Exxon—has a comparable ratio of 1.4.
However, if Chevron’s previous ratios were 0.8 and 1.1, then the current 1.4 suggests financial improvement through increasing assets or deleveraging (paying down debt). Conversely, if Exxon’s asset coverage ratio was 2.2 and 1.8 for the prior two periods, then the current 1.5 ratio could be the start of a worrisome trend of decreasing assets or increasing debt.
Important
Analyzing just one period’s asset coverage ratio isn’t enough. It’s crucial to look at trends over multiple periods and compare them with similar companies.
How Is Asset Coverage Ratio Calculated?
The asset coverage ratio is calculated by taking a company’s total assets, subtracting intangible assets and current liabilities (excluding short-term debt), and dividing the result by the total debt. It helps assess how well a company can cover its debt obligations using its tangible assets, with all necessary components on its balance sheet.
What Is a Good Asset Coverage Ratio?
A good asset coverage ratio generally exceeds 1.0, indicating that a company has enough assets to cover its debt. However, what is considered “good” can vary by industry. For example, utility companies typically have healthy ratios ranging from 1.0 to 1.5. However, a higher ratio in the range of 1.5 to 2.0 or more is often preferred for capital-intensive industries like capital goods.
What Are the Limitations of the Asset Coverage Ratio?
The asset coverage ratio has limitations, such as differences when comparing companies across industries and the accuracy of the asset values on the balance sheet, which often don’t match the liquidation values. It’s best to consider this ratio alongside other financial metrics to get a clearer picture of a company’s financial standing.
The Bottom Line
The asset coverage ratio is a financial metric that helps assess a company’s ability to repay its debt using its assets. A higher ratio generally indicates a lower risk to lenders, but the ideal ratio can vary depending on the industry.
While useful, this ratio has limitations and should be considered alongside other financial metrics, such as the debt-to-equity (D/E) ratio and the interest coverage ratio. It is also not effective for comparing companies across different industries. Lenders should also be wary that the book value of an asset can be substantially different from the sale price during a liquidation. Comparing the asset coverage ratio over time and against its industry peers provides a more comprehensive view of a company’s finances.













Leave a comment