Gold’s price has been correcting lower since our last report leaving traders wandering for its direction. In today’s report we intend to discuss fundamental issues that may be affecting the precious metal’s price action and conclude the report with a technical analysis of gold’s daily chart.
Negative correlation of the USD with Gold in effect
Over the past ten days gold’s price seems to have been maintaining the opposite direction to the USD index. It’s characteristic that gold’s price got a boost over the prementioned period, while the USD weakened against its counterparts. While the drop of the USD Index seems to have been halted forcing gold’s price to a correction lower. Overall we see the case of the two trading instruments being at the current stage in a negative correlation, hence a possible weakening of the USD may allow gold’s price to rise and vice versa. Furthermore we note that US bond yields despite some slight fluctuations, remained relatively stable. The relative stabilisation of US bond yields renders the possible effect from their path on gold’s price as minimal at the current stage. Yet should we see US yields rallying in the coming week, we may see the attractiveness of US bonds increasing and thus pose as a formidable alternative to gold for safe haven investments, which could weigh on golds’ price.
The uncertainty of US President Trump’s intentions tends to support the precious metal
The uncertainty stemming from US President Trump’s intentions seems to be maintained and may be keeping gold’s price supported. We note as an example the recent tariffs of 50% announced on European products on Friday and supporting gold’s price, only to be postponed on Monday for the 9th of July. Another interesting issue would be President Trump’s tax bill that has passed the House of Representatives and is now to be discussed in the US Senate. The bill raised some eye brows among economists, as it may widen the budget deficit and thus expedite the increase of the US national debt. Given also the recent downgrading of the US Governments’ rating by Moody’s the tax bill could enhance market worries for the US economic outlook, should it pass through the Senate and thus increase safe haven inflows for the shiny metal.
Financial releases of interest for Gold traders
Over the coming days there are two financial releases stemming from the US that could affect gold’s price. The one would the release of the revised US GPD rate for Q1 25 on Thursday. Should we see the rate slowing down we may see market worries for the US economic outlook being enhanced thus providing some support for gold’s price. On the flip side a possible acceleration of the GDP rate could weigh on gold’s price as market worries may ease. Also on Friday we note the release of the PCE rates for April, core and headline, and should the release imply a relative persistence of inflationary pressures in the US economy, we may see the release weighing on gold’s price as it may provoke a more hawkish stance on behalf of the Fed, a Fed which allready seems to have its doubts for the necessity of more rate cuts.
Worries for Middle East situation to escalate
As closure we tend to note the situation in Gaza as a going concern despite the issue having eased considerably its effect on gold’s price. According to Al Jazeera, Hamas has agreed to a ceasefire proposal put forth by the United States for Gaza, something that the US has denied and Israel has rejected. Should we see a ceasefire being agreed, we may see it weighing on gold’s price. On the contrary, a possible escalation of the situation in the Middle East, say for example should Israel hit Iranian nuclear facilities, could create asymmetric support for gold’s price.
Technical analysis
XAU/USD daily chart
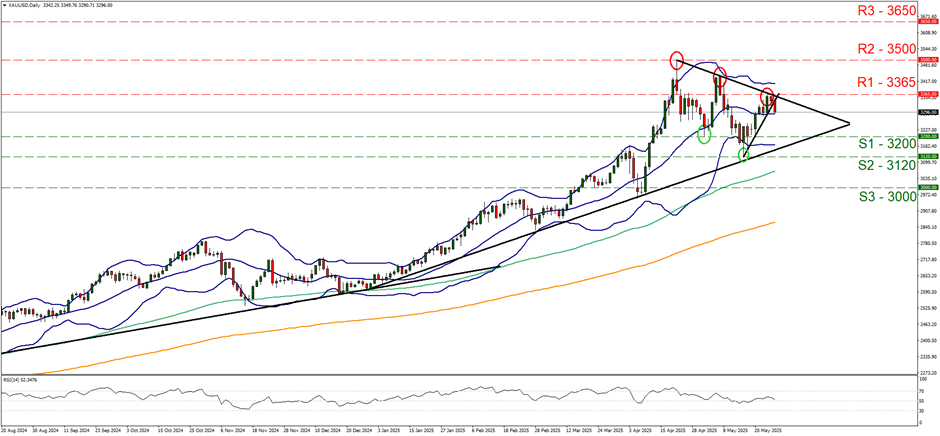
Support: 3200 (S1), 3120 (S2), 3000 (S3).
Resistance: 3365 (R1), 3500 (R2), 3650 (R3).
Gold’s price seems to have hit a ceiling on the 3365 (R1) resistance line, sliding lower since yesterday. The important element at the current stage may have been the breaking of the upward trendline guiding it since the 14th of May signaling an interruption of the upward motion of the precious metal’s price. At the same time, we note that the RSI indicator has corrected lower nearing the reading of 50 and implying that the bullish sentiment among market participants for gold’s price is easing and the market seems to be rather indecisive at the current stage for the direction of the next leg of gold’s price action. Hence we switch for the time being our bullish outlook in favour of a sideways motion bias for the shiny metal’s price direction. Yet should one take the longer perspective, we have to note that the precious metal’s price is between conflicting signals. On the one hand it’s price action since the 22nd of April is forming lower peaks and lower troughs, allowing for the formation of a downward trendline, yet on the other hand, the price action is supported by an upward trendline since the beginning of the year, with the two trendlines forming a symmetrical triangle. Thus a break out to either direction with a significant movement is possible at the current stage. Should the bulls take over once again we may see the price action of gold breaking the 3365 (R1) resistance line and continue higher to test if not break the All Time High level marked by the 3500 (R2) resistance level. Should the bears take over, we may see gold’s price action, breaking the 3200 (S1) support line clearly and start aiming if not breaking the 3120 (S2) support level, thus creating a new lower trough.