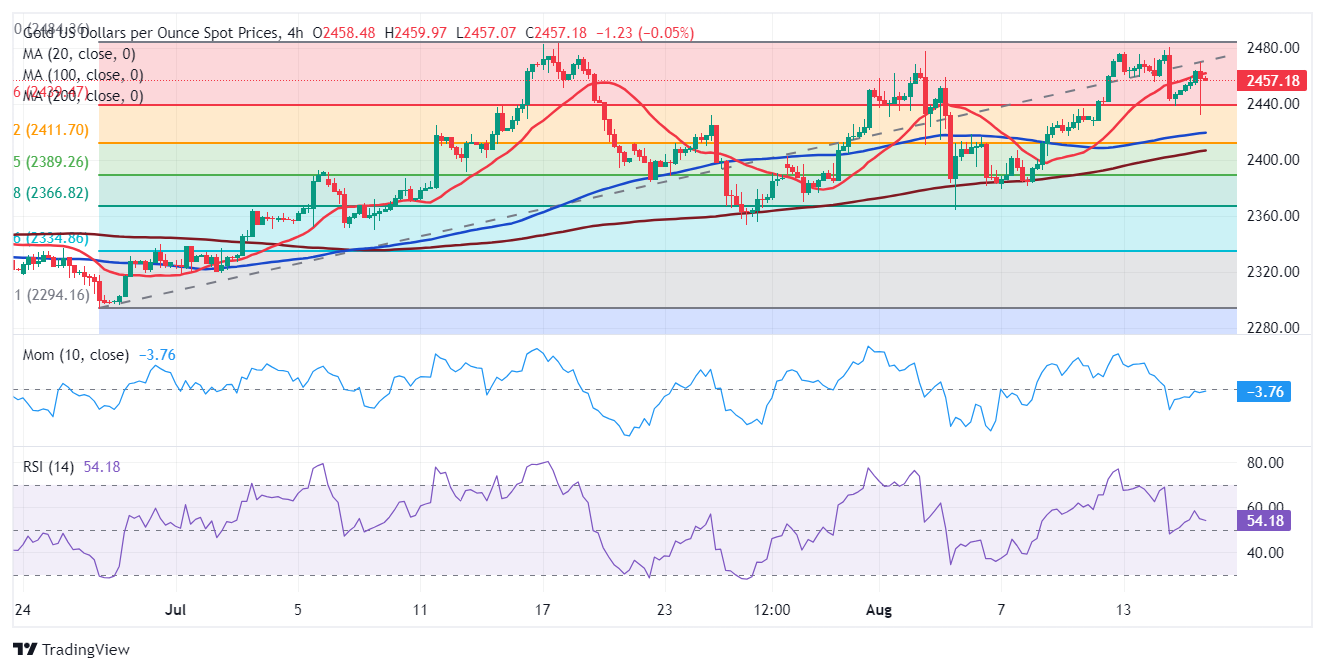
XAU/USD Current price: $2,457.30
- Financial markets welcomed US data pushing away recession-related fears.
- Stock markets are rallying with optimism, with US indexes challenging fresh weekly highs.
- XAU/USD holds within familiar levels, buyers still take their chances on dips.

Spot Gold trades with modest gains in the American afternoon, having experienced some early volatility. XAU/USD fell to $2,432.04 ahead of Wall Street’s opening as a batch of United States (US) data pushed speculative interest away from the safe-haven metal. Financial markets welcomed news that US Retail Sales rose by 1% in July, far better than the 0.3% advance anticipated. Furthermore, Initial Jobless Claims rose by less than anticipated in the week ending August 9, up 227K vs the 235K forecast.
The US Dollar surged with the news against all major rivals, while US indexes also advanced, as the numbers spooked fears of a recession while maintaining unchanged the odds for an upcoming Federal Reserve (Fed) interest rate cut. Stock markets remained optimistic after the opening, extending gains to fresh weekly highs, but the USD retreated. The second batch of US data was less encouraging, as Capacity Utilization hit 77.8% in July while Industrial Production in the same month was down 0.6%, both worse than expected and below June figures.
XAU/USD short-term technical outlook
The daily chart for the XAU/USD pair shows it remains within familiar levels, and while trading in the green, it posted a lower high and a lower low, usually seen as a bearish sign. Technical indicators have turned marginally lower but remain within positive levels, limiting the odds of a steeper decline. Finally, the pair keeps developing above all its moving averages, with the 20 Simple Moving Average (SMA) flat above bullish 100 and 200 SMAs. Overall, the case of a steeper leg lower seems unlikely.
In the near term, and according to the 4-hour chart, the pair is neutral-to-bullish. Technical indicators turned higher, but remain at around their midlines. Meanwhile, a mildly bullish 20 SMA provides dynamic resistance a few $ above the current level, while the longer moving averages extended their modest upward slopes below the current level. More relevantly, buyers defend the downside at around the 23.6% Fibonacci retracement of the June/July rally at $2,438.80.
Support levels: 2,438.80 2,4260.90 2,438.80
Resistance levels: 2,471.10 2,483.70 2,495.00


