Gold’s price has moved higher since the beginning of the week, with gold’s price currently just above $3300 per troy ounce. In today’s report we intend to discuss fundamental issues that may be affecting the precious metal’s price action and conclude the report with a technical analysis of gold’s daily chart.
US-China trade talks continue
The US and Chinese trade delegations met on Monday at the Lancaster House in London, in order to discuss their very public disagreements are the Geneva trade deal, which the US has accused China of violating. The meeting of the two sides came after a phone call between US President Trump and Chinese President Xi Jinping last Thursday. Following their phone call, President Trump stated that Chinese President Xi Jinping had agreed to let rare earth minerals and magnets flow to the US and that there was a “positive” conclusion to the talks, which may have been seen following China’s decision to grant temporary export licenses to rate-earth suppliers of the top three U.S automakers per Reuters. Overall, with the talks set to proceed today, we remain cautiously optimistic about the continued thawing of the trade relationship between China and the US. In turn, this could potentially weigh on gold’s price as market worries over the state of the global economy may begin to ease. Yet, should the talks break down, it could have the opposite effect and may thus aid gold’s price. In our view, we would not be surprised to see the trade talks continuing with some agreements being made for greater co-operation between the two nations, yet in order to be convinced that the two countries are willing to move forward together we would like to see substantial progress before being convinced that they have buried the proverbial hatchet.
Financial releases of interest for Gold traders
The financial release we would like to highlight for gold traders this week, is the release of the US CPI rates for May which are due out in tomorrow’s American trading session. The US CPI rates on a Core and Headline level on a year-on-year basis are expected to accelerate to 0.3% and 2.5% from 0.2% and 2.3%, respectively. Therefore, should the CPI rates come in as expected, they imply an acceleration of inflationary pressures in the US economy, which in turn could increase pressure on the Fed to refrain from cutting interest rates in the near future. Thus, such a scenario could potentially aid the dollar whilst weighing on gold’s price given the two’s assumed inverse relationship. However, should the CPI rates fail to showcase an acceleration of inflationary pressures, it may have the opposite effect and could thus weigh on the greenback whilst potentially aiding gold’s price.
Technical analysis
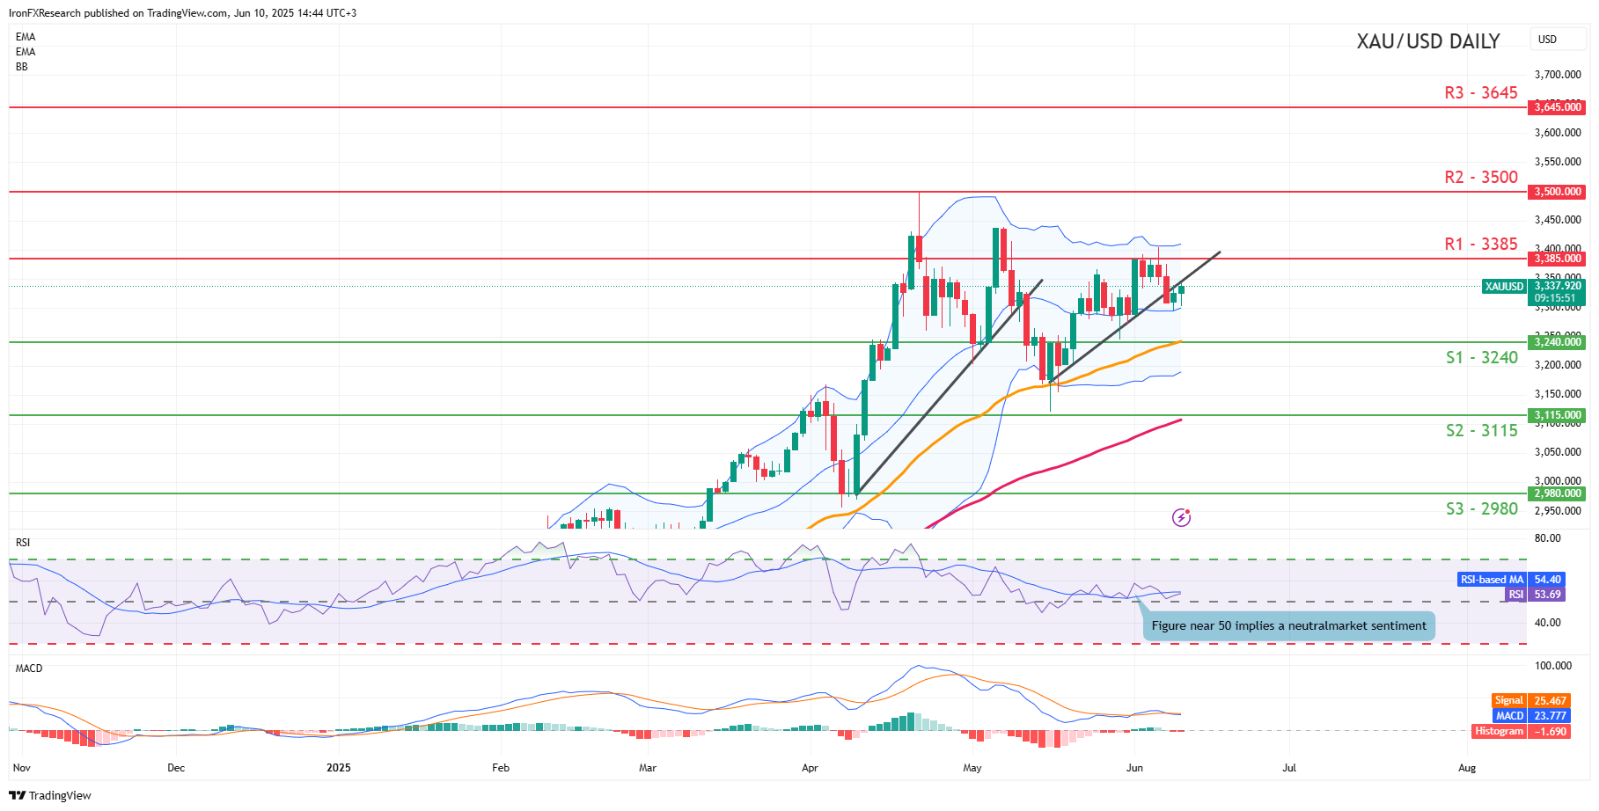
XAUUSD daily chart
- Support: 3240 (S1), 3115 (S2), 2980 (S3).
- Resistance: 3385 (R1), 3500 (R2), 3645 (R3).
Gold’s price appears to be moving in a sideways bias after failing to clear our 3385 (R1) resistance level. We opt for a sideways bias for the precious metal’s price and supporting our case is the break below our upwards moving trendline which was incepted on the 15th of May, in addition to the RSI indicator below our chart which currently registers a figure near 50, implying a neutral market sentiment. For our sideways bias to be maintained we would require the precious metal’s price to remain confined between the 3240 (S1) support level and the 3385 (R1) resistance line. On the other hand, for a bullish outlook we would require a clear break above the 3240 (S1) support level with the next possible target for the bulls being the 3500 (R2) resistance line. Lastly, for a bearish outlook we would require a clear break below the 3240 (S1) support level with the next possible target for the bears being the 3115 (S2) support line.