July 17, 2025
Operating Assets

Cloud Surge and Strategic Investments …

Total Revenue: $15.9 billion, up 11% from last year. Non-GAAP EPS: $1.70. GAAP EPS: $1.19. Total Cloud Revenue (SaaS + IaaS): $6.7 billion, up 27%. Total Cloud Services and License Support Revenue: $11.7 billion, up 14%. IaaS Revenue: $3 billion, up 52%. OCI Consumption Revenue: Up 62%. Cloud Database Services Revenue: Up 31%, annualized revenue

Read More
Operating Assets

Strong Subscription Growth and AI …

Subscription Revenue: $2.059 billion, up 13% year-over-year. Total Revenue: $2.240 billion, growth of 13%. 12-Month Subscription Revenue Backlog (cRPO): $7.63 billion, increasing 15.6%. Total Subscription Revenue Backlog: $24.62 billion, up 19%. Gross Revenue Retention Rate: 98%. Non-GAAP Operating Income: $677 million, representing a non-GAAP operating margin of 30.2%. GAAP Operating Income: $39 million, impacted by

Read More
Fixed Assets

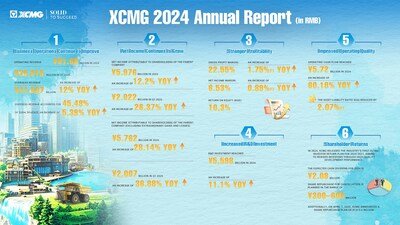
Empowering New Industrialization, XCMG Machinery’s 2024 Annual Report Highlights High-Quality Development

XUZHOU, China, May 13, 2025 /PRNewswire/ — XCMG Machinery (“XCMG”, SHE:000425), a global leader in construction machinery, has published its 2024 Annual Report, showing strong performance with net profit attributable to shareholders reaching CNY 5.976 billion (USD 821.866 million), a 12.2 percent increase year-on-year. The total revenue remains stable at CNY 91.66 billion (USD 12.61

Read More
Operating Assets

Mogo Reports Results for Q1 2025

Total Revenue of $17.3 million Wealth Revenue growth of 41% over prior year Payments Revenue growth of 34% over prior year Solid Balance Sheet with Cash1, Marketable Securities & Investments of $38.8 million Mogo reports in Canadian dollars and in accordance with IFRS VANCOUVER, British Columbia, May 08, 2025–(BUSINESS WIRE)–Mogo Inc. (NASDAQ:MOGO) (TSX:MOGO) (“Mogo” or

Read More
Operating Assets

Record EBITDA and Strategic …

Total Revenue: $112.6 million, up 1.6% year over year. Non-GAAP Gross Margin: 35.8%. Adjusted EBITDA: $14.9 million, up 17% year over year. Non-GAAP EPS: $0.88, up 13% year over year. North America Revenue: $49.4 million, up 11% year over year. International Revenue: $63.2 million, down 5% year over year. GAAP Operating Expenses: $30 million, down

Read More
Operating Assets

Navigating Growth Amid Market Challenges

Q: Tim, can you provide a framework for thinking about tariffs on the revenue side and how they might affect your ability to take market share? A: Tim Breen, CEO: We haven’t seen significant short-term impacts from tariffs on orders. However, for the second half of 2025 and into 2026, the broader impact remains uncertain.

Read More
Operating Assets

Strong Revenue Growth and Strategic …

Total Revenue: $66.8 million for Q1, a 12% increase from Q1 2024. Subscription Software Revenue: $32.2 million in Q1, up 30% year-over-year. Gross Margin: 52.8% in Q1, an increase of 4.3 percentage points from Q4. Adjusted EBITDA: Negative $12.2 million, improved from negative $45.6 million in Q1 2024. Cash and Marketable Securities: $222 million at

Read More
Operating Assets

Strong Revenue Growth Amidst Challenges

Total Revenue: $42.3 billion, up 16% year-over-year. Total Expenses: $24.8 billion, up 9% year-over-year. Operating Income: $17.6 billion, representing a 41% operating margin. Free Cash Flow: $10.3 billion. Cash and Marketable Securities: $70.2 billion. Debt: $28.8 billion. Family of Apps Revenue: $41.9 billion, up 16% year-over-year. Family of Apps Ad Revenue: $41.4 billion, up 16%

Read More
Operating Assets

Strategic Growth and Financial Resilience

Total Revenue: $25.4 million, up 2% from $25 million in 2023. Cloud Infrastructure and Disaster Recovery Service Revenue: $12.3 million, a 27% increase year-over-year. Annual Recurring Revenue Run Rate: $21.5 million. Net Income: $513,000, up 71% from $299,000 in 2023. Adjusted EBITDA: $2.37 million, compared to $1.64 million last year. Cash and Marketable Securities: $12.3

Read More
Operating Assets

Revenue Surge Amid Rising Expenses

Total Revenue: $150 million for the year ended December 31, 2024, up from $58.7 million in 2023. Revenue from Collaborative and Other Agreements: $118.9 million. MARGENZA Net Sales: $16.4 million. Contract Manufacturing Revenue: $13.1 million. Research and Development Expenses: $177.2 million, up from $166.6 million in 2023. Selling, General, and Administrative Expenses: $71 million, up

Read More