
- Bearish momentum declines after Dogecoin falls under the $0.20 mark.
- The derivatives data reveal a shakeout of bearish-aligned traders amid additional inflow of funds.
- DOGE’s technical outlook suggests a short-term recovery as it stabilizes above a crucial support level.
Dogecoin (DOGE) has been consolidating under $0.20 since Saturday, making a short-term range with $0.1863 as the lower boundary. DOGE bottoms out the previous week’s downfall with this range breakout on Tuesday, resulting in an increased short-liquidation spike and a bullish technical outlook.
Derivatives data back Dogecoin’s reversal chances
CoinGlass data shows the 24-hour Dogecoin volume rising by 21% to $3.44 billion while the Open Interest (OI) surges by 2.70%, reaching $2.09 billion. A boost in OI relates to rising fund inflow in the derivatives market, typically leading to increased buying interest. Notably, the 24-hour liquidation data shows that nearly double the bearish positions were wiped out, worth $2.64 million, compared to the long-sided positions worth $1.42 million.
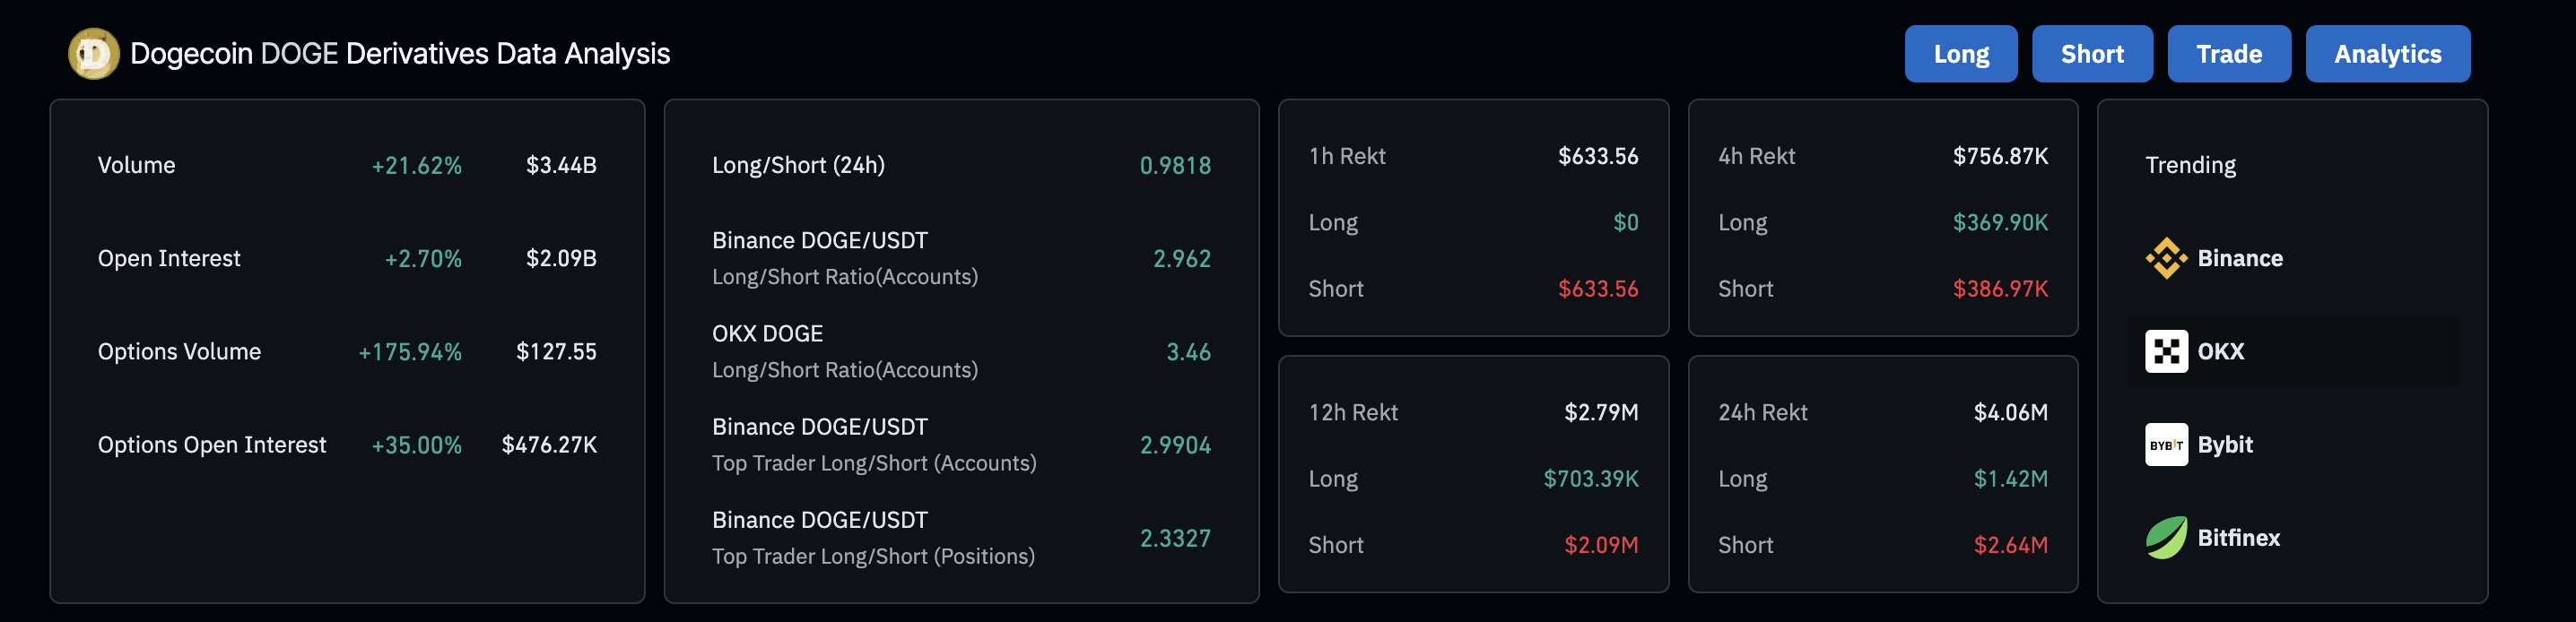
DOGE derivatives data. Source: Coinglass
Additionally, the OI-weighted funding rate of Dogecoin at 0.0075% reflects an increase in buying activity. Positive funding rates help align rising derivatives prices with spot prices as leveraged-buying activity grows.
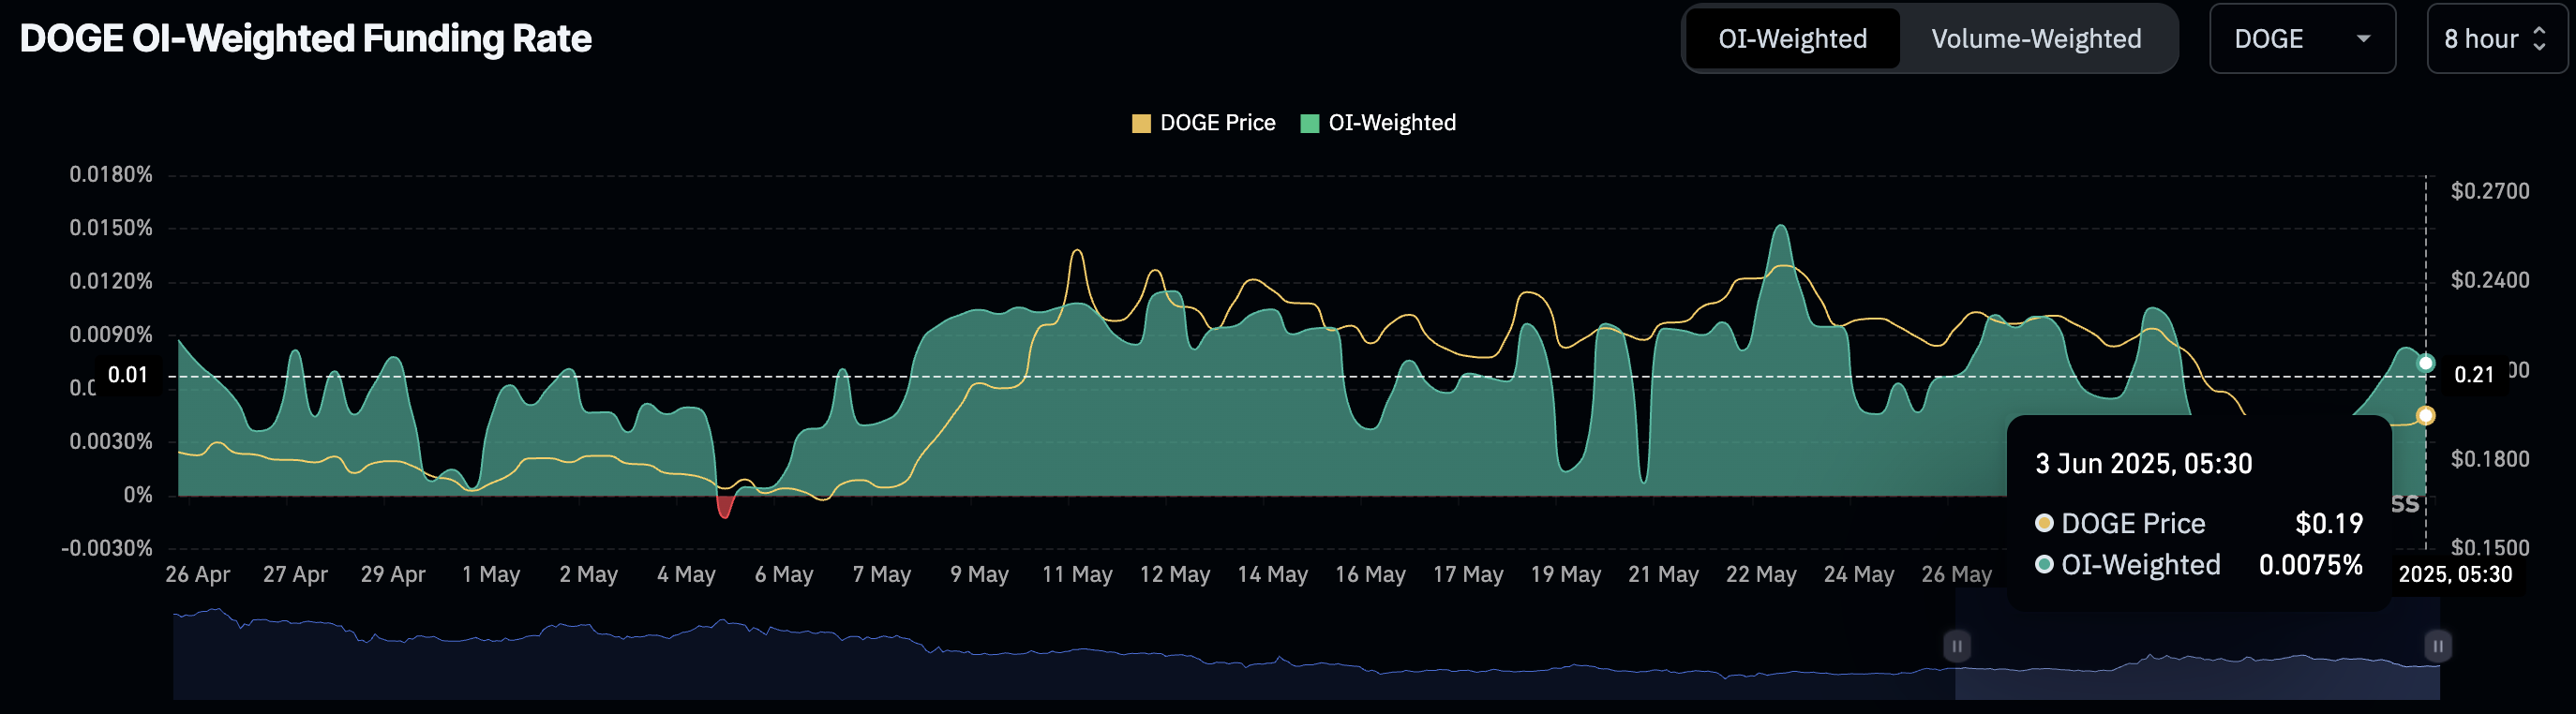
DOGE OI-Weighted Funding Rate. Source: Coinglass
Finally, the long/short ratio chart readings at 1.06 indicate an increased bullish sentiment, as more traders anticipate a price surge. The indicator is based on taker buy/sell volume, with the taker buy volume accounting for 51.53% in the last four hours.
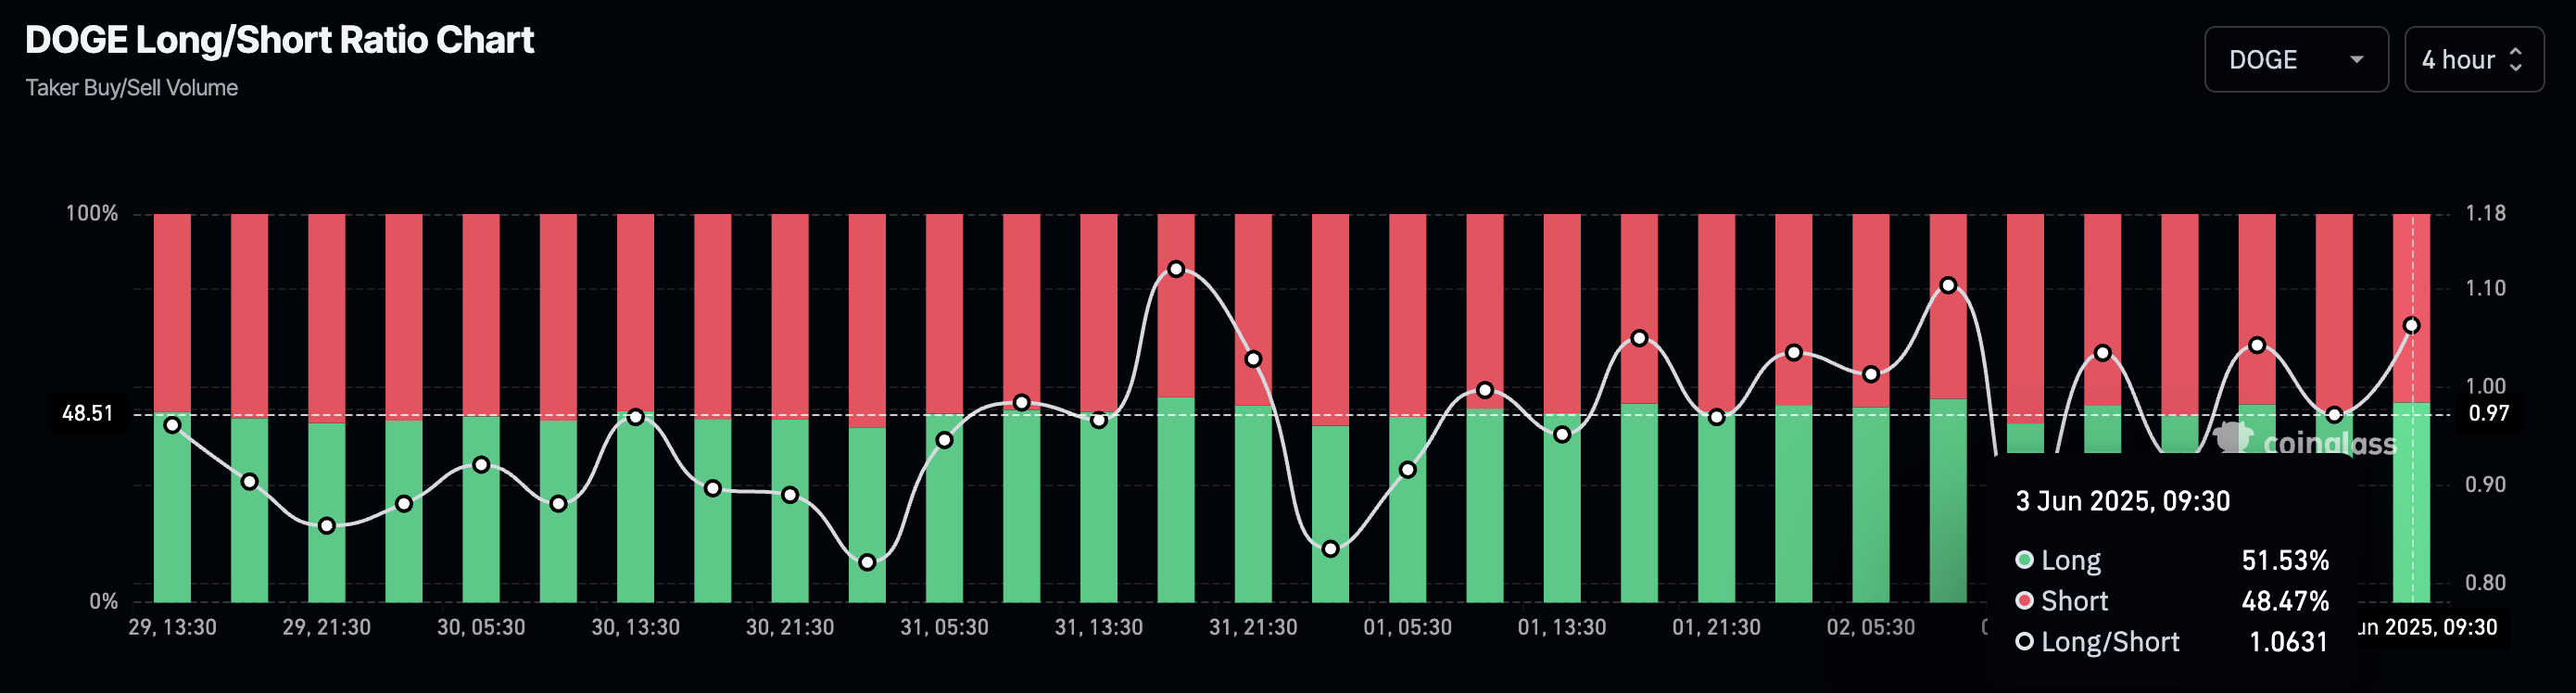
DOGE Long/Short Ratio Chart. Source: Coinglass
Dogecoin’s breakout faces multiple hurdles
Dogecoin trades at $0.1959 at press time on Tuesday, breaking above a short-term range formed between $0.1863 and $0.1950 after last week’s 14% fall. The meme coin records mild intraday gains and a candle closing above the range’s upper boundary.
With the bullish breakout, the technical indicators are heating up. The Moving Average Convergence/Divergence (MACD) indicator crosses above its signal line in the negative territory. The average lines rise towards the center line, reflecting a growth in bullish momentum.
Further up, the Relative Strength Index (RSI) at 47 shows a sharp recovery from the oversold zone, suggesting a significant decline in bearish momentum. As the RSI remains under the halfway level, it shows extended room for growth before reaching overbought conditions.
The range breakout signals a price surge to the next resistance level at $0.2145. However, the 200-period Exponential Moving Average (EMA) at $0.2074 acts as an intermediary hurdle.
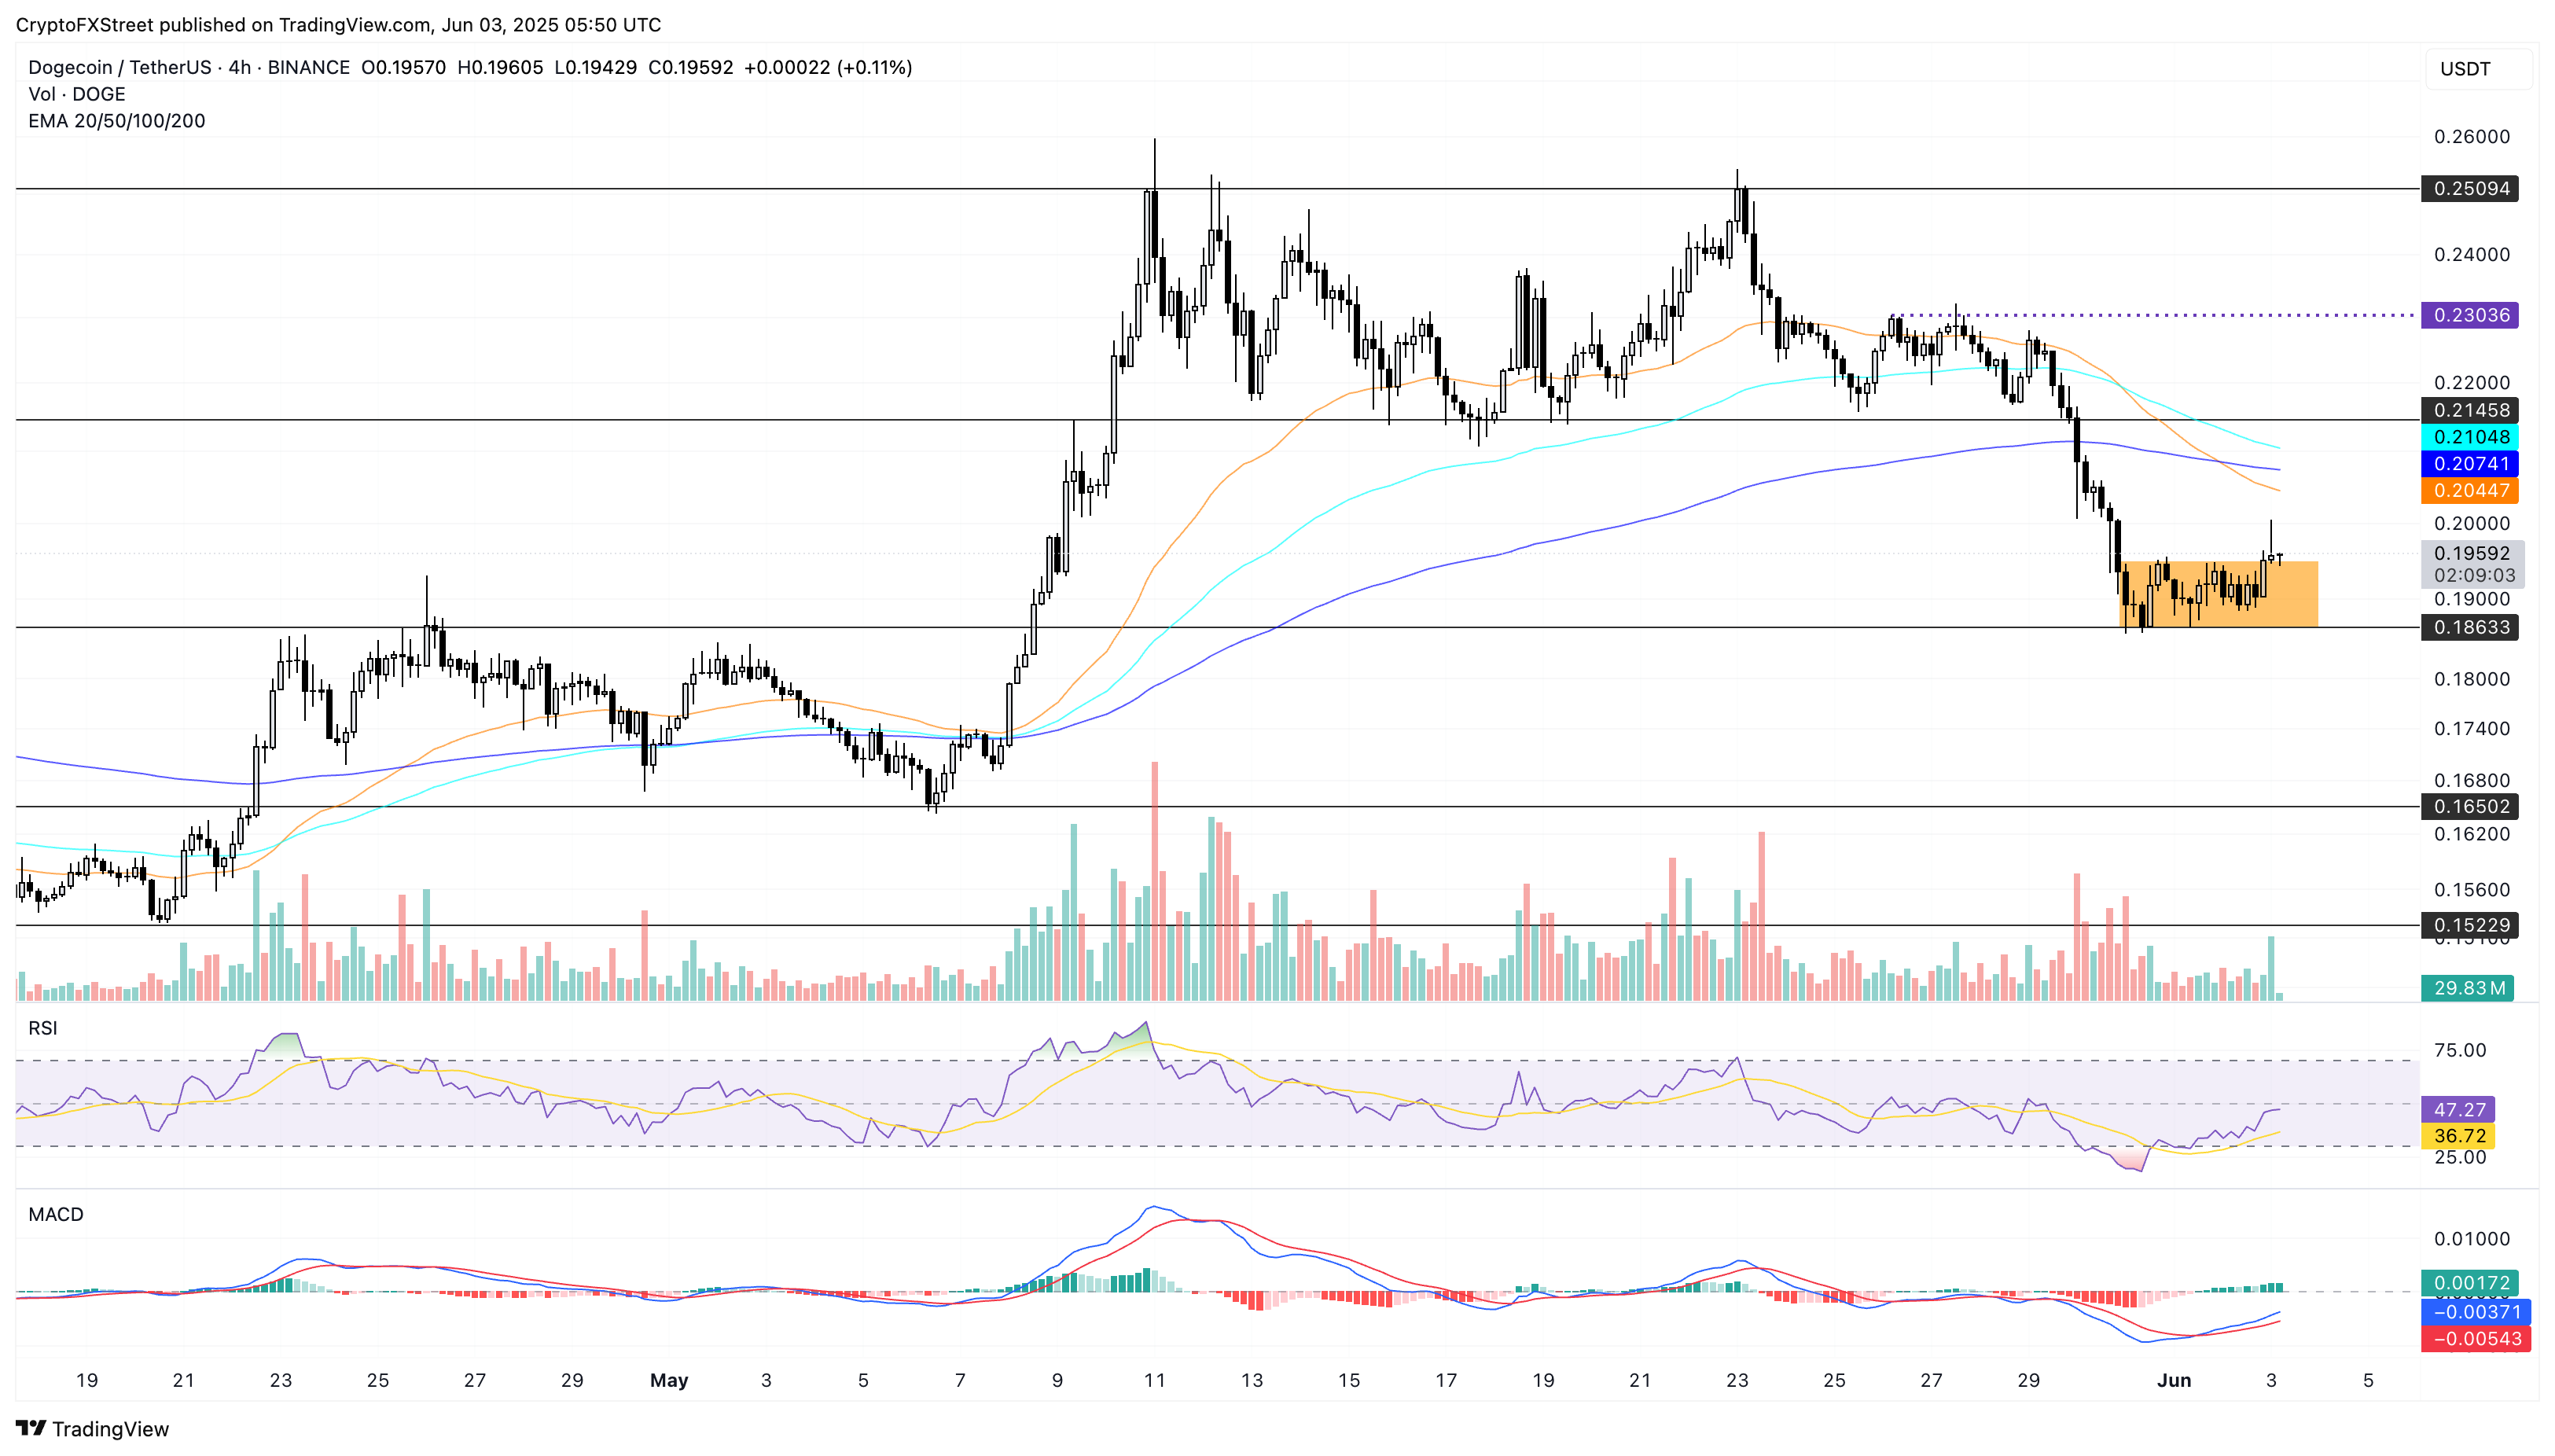
DOGE/USDT 4-hour price chart. Source: Tradingview
However, a reversal in DOGE could retest the $0.1863 support level. In such a case, traders could find shorting opportunities if it closes below the level, with the next support at $0.1650.