LOS ANGELES – Home shoppers had more options in March than they’ve seen in years—but they didn’t move quickly.
According to new data from Zillow’s March 2025 Market Report, home prices across the U.S. leveled off last month as a surge in new listings outpaced buyer activity. While mortgage rates hit their lowest point of the year, pending sales remained flat, suggesting buyers are still hesitant amid ongoing affordability challenges.
Zillow’s data shows that sellers listed more than 375,000 homes in March—marking a near 9% increase from the year before—while inventory climbed to its highest March level since 2020.
Why are home prices flattening despite lower mortgage rates?
The backstory:
Sellers brought more than 375,000 homes to market in March—a nearly 9% jump from last year—while pending sales stayed flat. That imbalance pushed total inventory to 1.15 million homes, the highest for any March since 2020.
Despite average mortgage rates falling to 6.65% in March (down from 6.82% a year earlier), buyers didn’t surge. Instead, about 265,000 listings went into pending sale—110,000 fewer than came on the market.
Home values grew just 0.2% month-over-month, the slowest March growth since at least 2018. In contrast, the second-slowest March gain in that period was 0.7%.
Where are prices rising—and falling?
Local perspective:
Home values still rose in 41 of the 50 largest metro areas, with the strongest month-over-month gains in San Jose (1.3%), Milwaukee (0.9%), San Francisco (0.9%), Pittsburgh (0.8%), and Hartford (0.7%).
But prices fell in five key cities—all in Florida except San Antonio. Miami led the decline at -0.4%, followed by Tampa (-0.3%), Orlando (-0.2%), Jacksonville (-0.1%), and San Antonio (-0.1%).

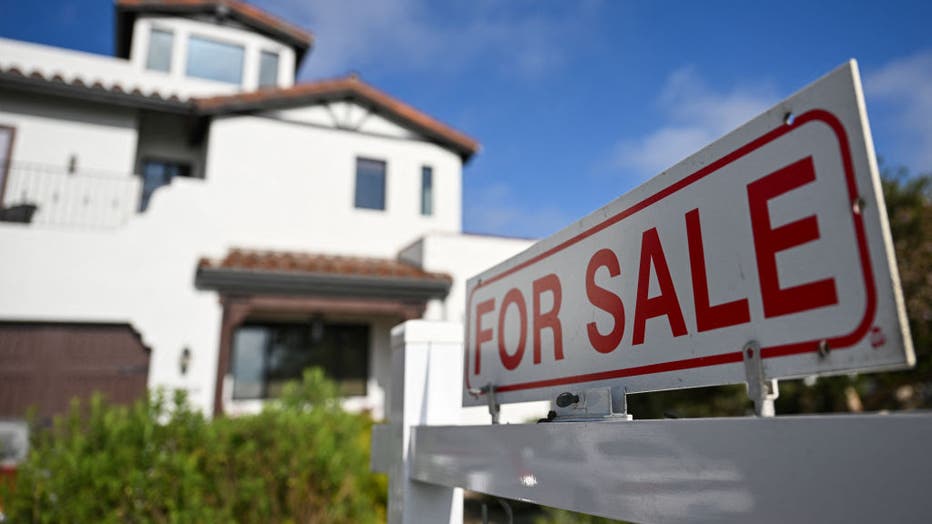
FILE – A for sale sign is displayed outside of a home for sale. (Photo by PATRICK T. FALLON/AFP via Getty Images)
Year-over-year, the largest gains came from San Jose (5.5%), Cleveland (5.3%), and Providence (5.2%), while the steepest drops were in Austin (-4.6%), Tampa (-4.5%), and San Antonio (-2.7%).
Are homes becoming more affordable?
What we know:
Affordability remains a key challenge. A mortgage payment on a typical home now costs about $1,855 per month, assuming a 20% down payment. That eats up 35.3% of the median household income—still above the 30% threshold considered financially burdensome.
Though that’s a slight improvement from last year, the typical 20% down payment still runs around $72,000—a major barrier for first-time buyers.
To attract interest, more sellers are lowering prices. About 23.5% of listings on Zillow received a price cut in March, the highest March share since at least 2018.
Is the market still favoring sellers?
Big picture view:
Zillow’s market heat index shows the market is leaning toward sellers again after sitting in neutral territory earlier this year.
The hottest seller’s markets in March were Buffalo, Hartford, San Francisco, Boston, and San Jose. In contrast, Miami, New Orleans, Jacksonville, and Tampa were among the strongest buyer’s markets.
While newly pending listings rose 28.3% from February to March, they were still nearly flat year-over-year—up just 0.3%. Median time to contract was 17 days, six days faster than February, but four days slower than this time last year.
What’s happening with rent prices?
By the numbers:
Rents rose 0.6% month-over-month, slightly above the typical pre-pandemic pace. Year-over-year, rents increased by 3.5%, with the biggest gains in Hartford (6.8%), Cleveland (6.7%), and Providence (5.9%).
Only one major metro saw a monthly rent decline: Buffalo (-0.2%). Two others—Louisville (0%) and Philadelphia (0.1%)—barely moved.
The Source: This report is based on March 2025 housing market data provided by Zillow and contextualized using publicly available information on mortgage rates and affordability metrics. Data includes national and metro-level figures on home prices, pending sales, inventory, and rental trends.


