- Gold price looks to extend the pullback from record highs of $3,058 early Friday.
- The US Dollar and Treasury yields rebound as the Fed seems in no rush to cut rates.
- Gold price remains a ‘buy-the-dips’ trade on the daily chart amid global jitters.
Gold price is looking to extend its previous retreat from all-time highs of $3,058 in Asian trading on Friday. Despite the pullback, Gold price remains on track to book the third consecutive weekly gain.
Gold price eyes a pullback before the next leg up
Traders remain poised to cash in on their Gold long positions after the latest record rally heading into the week while bracing for next week’s US core Personal Consumption Expenditures (PCE) Price Index.
However, any retracement in Gold price is likely to be seen as a good buying opportunity as US President Donald Trump’s tariff-led economic concerns and persistent bets for two Federal Reserve (Fed) interest-rate cuts this year will continue to act as a tailwind for the traditional store of value.
Although Fed Chair Jerome Powell said during his post-policy meeting press conference on Wednesday that they are in no rush to cut rates, their projections of two rate reductions for the current year remain intact, giving Gold buyers enough reason to stay hopeful.
Furthermore, the Fed raised stagflation fears in its quarterly economic projections, mainly due to the impact of Trump’s tariffs, keeping the demand for Gold as an inflation-hedge alive.
Not to forget the lingering Middle East geopolitical tensions between Israel and Hamas. At least 91 Palestinians were killed and dozens wounded in airstrikes across Gaza on Thursday after Israel resumed bombing and ground operations, Reuters reported, citing Palestine’s health ministry.
That said, attention now turns to Fedspeak and President Trump’s Oval Address as traders anticipate reciprocal tariffs effective on April 2 amid uncertainty over the Russia-Ukraine truce.
Speeches from Chicago Fed President Austan Goolsbee and New York Fed President John Williams will be closely followed as they return from the ‘blackout’ period.
Gold price technical analysis: Daily chart
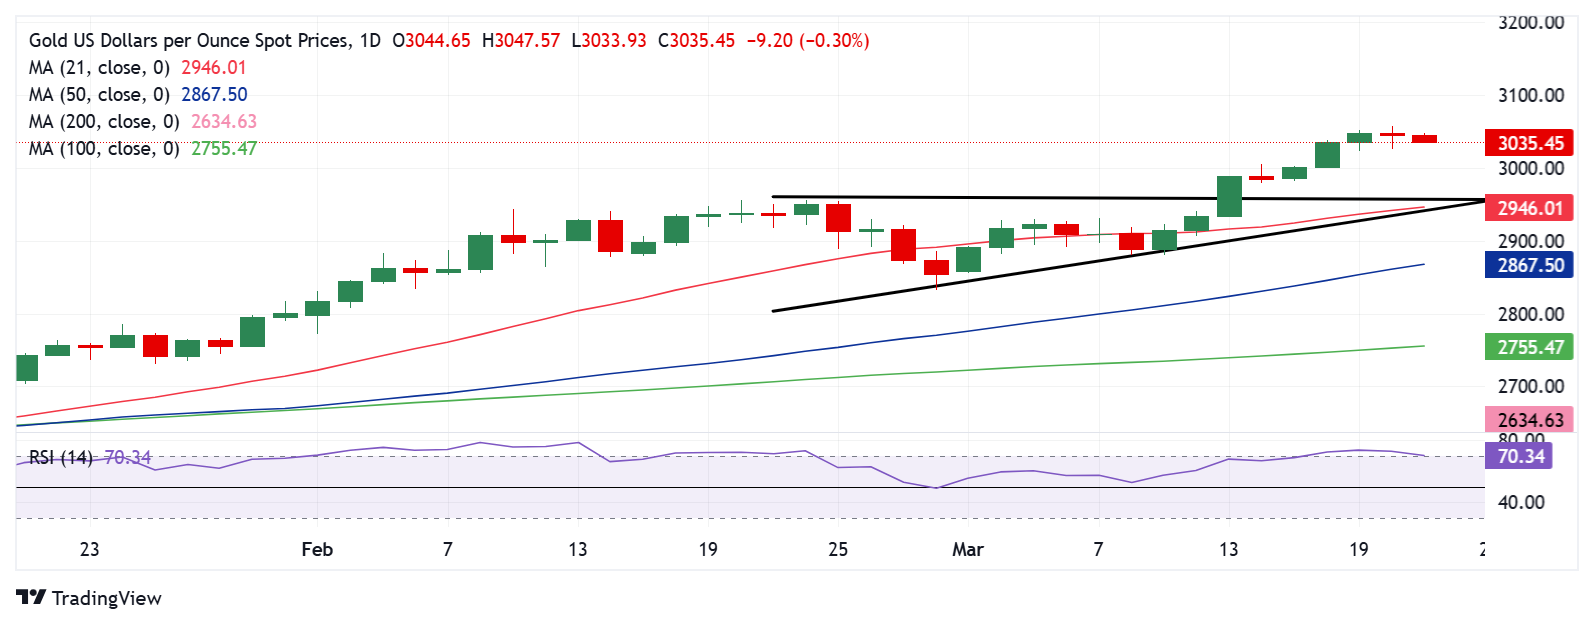
Technically, the Gold price retains its upside potential as the ascending triangle breakout remains in effect.
However, a brief pullback could be in the offing as the 14-day Relative Strength Index (RSI) eases but remains within the overbought region, near 70.50, at the time of writing.
Should the corrective decline gather steam, Gold price could test Wednesday’s low of $3,023, below which the $3,000 level will be targeted.
The next downside caps are at the weekly low of $2,982 and the $2,945 demand area, where the 21-day Simple Moving Average (SMA) and the triangle support coincide.
Alternatively, Gold price could retest the record high of $3,056 if buyers regain poise. Further up, the triangle target measured at $3,080 will be put to the test.