- Gold price consolidates gains below $3,000 as the Fed week kicks in.
- US Dollar and Treasury yields stay defensive on trade war-led economic woes.
- Gold price eyes more upside as the daily technical setup stays bullish.
Gold price is trading better bid below the historic high of $3,005 reached last Friday. The upside potential in Gold price remains intact amid favorable fundamental and technical factors.
Gold price looks to US Retail Sales data ahead of Fed
On the fundamental front, US President Donald Trump sparked global trade war and its impact on the US economic prospects, latest geopolitical tensions and the increased odds that the US Federal Reserve (Fed) will stick to its easing cycle continue to underpin the safe-haven appeal of the Gold price while remaining a drag on the US Dollar (USD).
Over the weekend, geopolitical tensions escalated between the US and Yemen after the US launched airstrikes on large-scale strikes on Yemen, targeting the Iran-backed militant group – Houthis. In response, Houthis attacked US vessels in the Red Sea, which Trump vowed to stop, warning that “hell will rain down” on the Houthis if they continue.
Meanwhile, Israeli military strikes killed at least 15 Palestinians in the Gaza Strip over the past 24 hours. Additionally, Trump’s envoy Steve Witkoff said on Sunday that he expected the US President to speak with Russian President Vladimir Putin this week after the Kremlin supported the 30-day cease-fire with Ukraine.
Gold price also find support from the latest measures launched by China on Sunday to boost consumption and raise incomes. China is the world’s top Gold consumer. Further, mostly upbeat Chinese activity data for the January and February period also helps keep Gold price afloat.
However, it remains to be seen if Gold price sees a fresh leg higher as the US Retail Sales data will likely provide fresh hints on the state of the US economy, driving the next direction in the USD.
That said, Gold traders will refrain from placing fresh bets on the bright metal ahead of Wednesday’s Fed policy announcements and the updated economic projections.
Gold price technical analysis: Daily chart
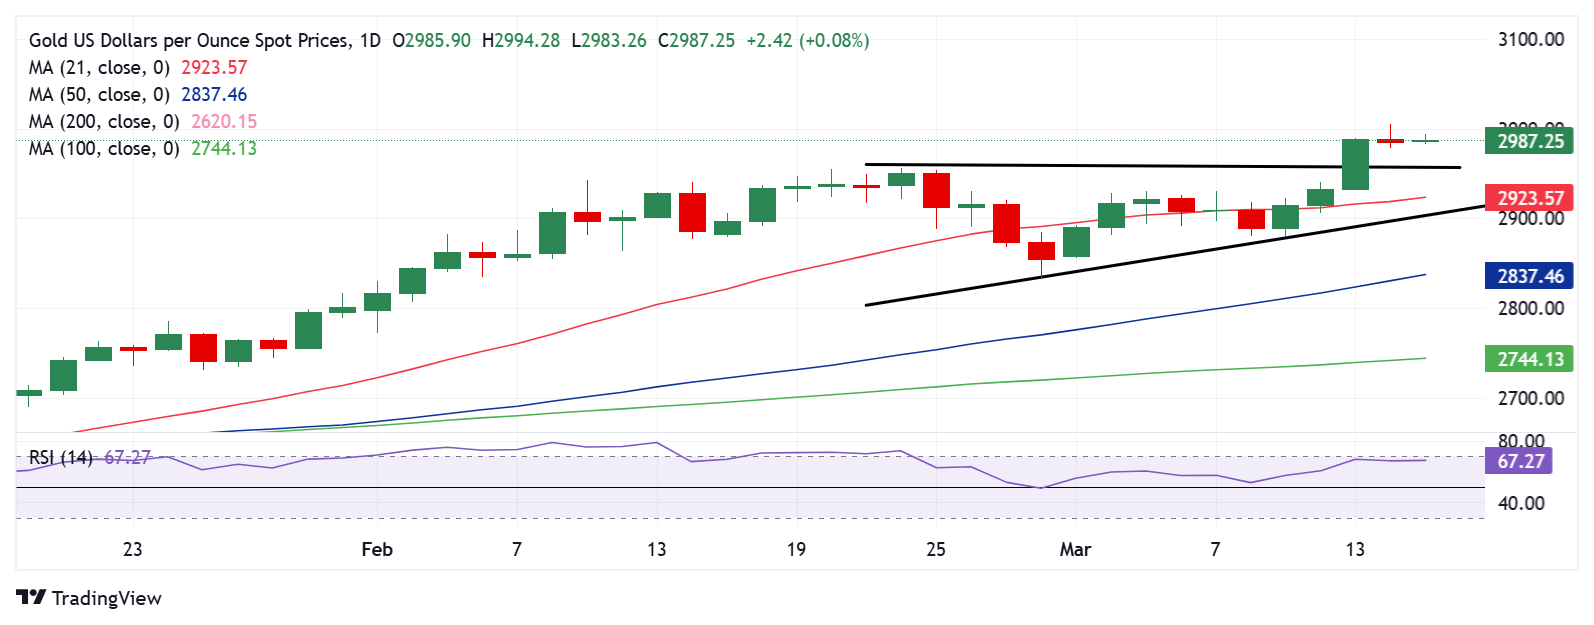
Gold price remains exposed to upside risks following the upside break of an ascending triangle formation last Thursday.
Gold buyers need acceptance above the $3,000 psychological barrier to extend the record rally toward the $3,050 mark.
The 14-day Relative Strength Index (RSI) sits just beneath the overbought region, which is currently near 67, keeping buyers hopeful.
Therefore, any retracement in Gold price will likely be considered a good dip buying opportunity.
On a corrective downside, Gold price could challenge the previous triangle resistance-turned-support at $2,956, below which the 21-day Simple Moving Average (SMA) at $2,923 will be tested.
The last line of defense for buyers is at the triangle support line, pegged at $2,906.
Economic Indicator
Retail Sales (YoY)
The Retail Sales data, released by the US Census Bureau on a monthly basis, measures the value in total receipts of retail and food stores in the United States. Retail Sales measure the change in the total value of goods sold at the retail level during a year. Retail Sales data is widely followed as an indicator of consumer spending, which is a major driver of the US economy. A result higher than expected is typically viewed as positive or bullish for the USD, whereas a lower than expected result is considered negative or bearish for the USD.
Next release: Mon Mar 17, 2025 12:30
Frequency: Monthly
Consensus: –
Previous: 4.2%
Source: US Census Bureau