XAU/USD Current price: $3,372.92
- Dismal US data and trade tensions weighed on the US Dollar.
- ECB monetary policy decision and US NFP report coming up next.
- XAU/USD keeps pressuring weekly highs, break beyond $3,400 at sight.
Spot Gold resumed its advance on Wednesday, although XAU/USD trades below the weekly high set at $3,392.22. The bright metal hovers around $3,370, helped by a fresh round of US Dollar (USD) selling after the release of discouraging United States (US) data.
On the one hand, the country reported that the private sector added measly 37K new job positions in May, according to the ADP Employment Change report. Additionally, the ISM Services Purchasing Managers’ Index (PMI) contracted to 49.9 in the same month, down from the 51.6 posted in April and below the 52 anticipated.
The USD came under modest selling pressure with the news, as speculative interest awaits first-tier releases scheduled for the upcoming days. The European Central Bank (ECB) will announce its decision on monetary policy on Thursday, while the US will publish the May Nonfarm Payrolls (NFP) report on Friday.
In the meantime, US President Donald Trump and his Chinese counterpart, Xi Jinping, engaged in another round of mutual accusations. Trump claimed that his Xi Jinping was “extremely hard” to make a deal with, while Beijing’s Foreign Minister Wang Yi called on the US to “meet China halfway.” A hinted call within the next few days between the two leaders partially cooled concerns, which, anyway, keep the mood contained. At the time being, US indexes are marginally up, suggesting market participants are holding on to modest hopes.
XAU/USD short-term technical outlook
The daily chart for the XAU/USD pair shows it keeps consolidating recent gains, and that the risk skews to the upside. It keeps developing above a flat 20 Simple Moving Average (SMA) currently at around $3,293.30. The Momentum indicator eases from its intraday peak but holds well above its midline, while the Relative Strength Index (RSI) indicator consolidates at around 57. Finally, XAU/USD remains far above bullish 100 and 200 SMAs, which reflect the dominant bullish trend regardless of the ongoing consolidation.
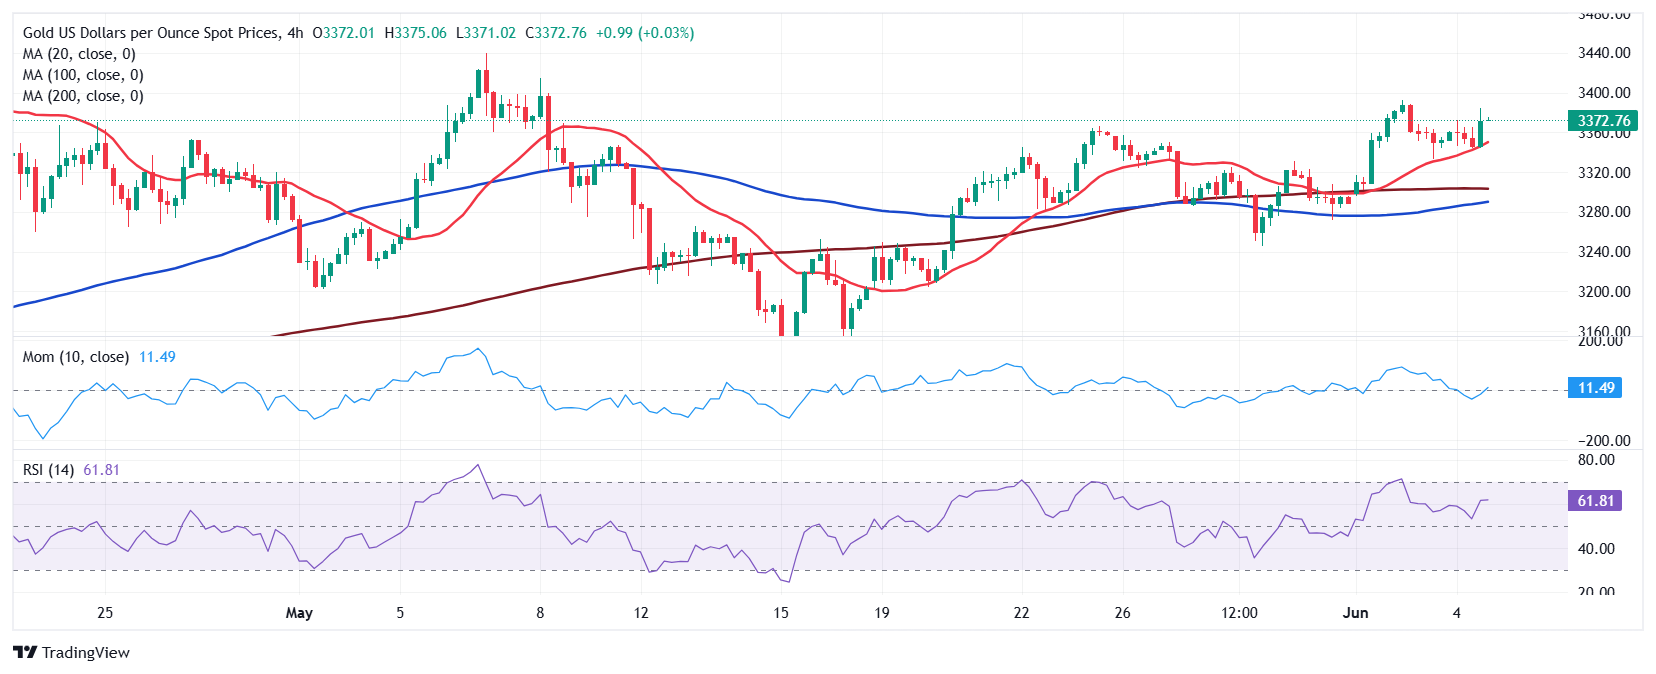
The 4-hour chart favors a bullish extension, although the momentum is missing. Technical indicators hold within positive levels, but with uneven strength. At the same time, a bullish 20 SMA keeps providing intraday support while advancing beyond flat 100 and 200 SMAs.
In the near term, and according to the 4-hour chart, XAU/USD maintains its positive bias. The pair bounced from a mildly bullish 20 SMA, which advances beyond directionless 100 and 200 SMAs. Finally, technical indicators eased from their recent peaks, but consolidate within positive levels, far from suggesting a steeper decline.
Support levels: 3,361.20 3,346.55 3,333.10
Resistance levels: 3,382.60 3,394.05 3,408.45