
XAU/USD Current price: $2,940.67
- Geopolitical woes gather market’s attention amid a scarce macroeconomic calendar.
- Market participants resume US Dollar buying as Wall Street turns red.
- XAU/USD retreats from fresh record highs, extends consolidative phase.
Spot Gold maintained its positive momentum heading into the American opening, hitting a fresh record high of $2,956.25. The bright metal advanced despite the market’s optimism at the weekly opening.
Investors welcomed the result of the German election, as the Conservatives Party clinched a victory, although with less than 30% of the total votes. Still, a coalition government with the “failed” Social Democratic Party, which came third, fueled hopes for the country’s economic outlook.
XAU/USD, however, retreated roughly $20 after Wall Street’s opening amid a souring market mood. US indexes trimmed early gains, and only the Dow Jones Industrial Average (DJIA) holds on to modest gains. As a result, the US Dollar (USD) trades with a firmer tone across the FX board.
Attention remains on geopolitical woes. On the one hand, the United States (US) government is looking for a $500bn minerals deal with Ukraine, with Washington seeking ta tough payback for any future military aid to Kyiv. On the other hand, Russia launched its biggest-ever aerial attack on Ukraine, using 267 drones, despite claiming its willingness to reach a deal.
The macroeconomic calendar has little relevant to offer until next Friday, when the US will release an update on the Personal Consumption Expenditures (PCE) Price Index, the Federal Reserve’s (Fed) favourite inflation gauge.
XAU/USD short-term technical outlook
Technically, the daily chart for the XAU/USD pair shows it trades within a well-limited range for a fourth consecutive day, albeit the risk remains skewed to the upside. The Relative Strength Index (RSI) indicator extends its consolidative phase at around 71, while the Momentum indicator eased from its recent highs but remains well above its midline. Finally, moving averages maintain their firmly bullish slopes far above the current level, with the 20 Simple Moving Average (SMA) providing dynamic support at around $2,872.
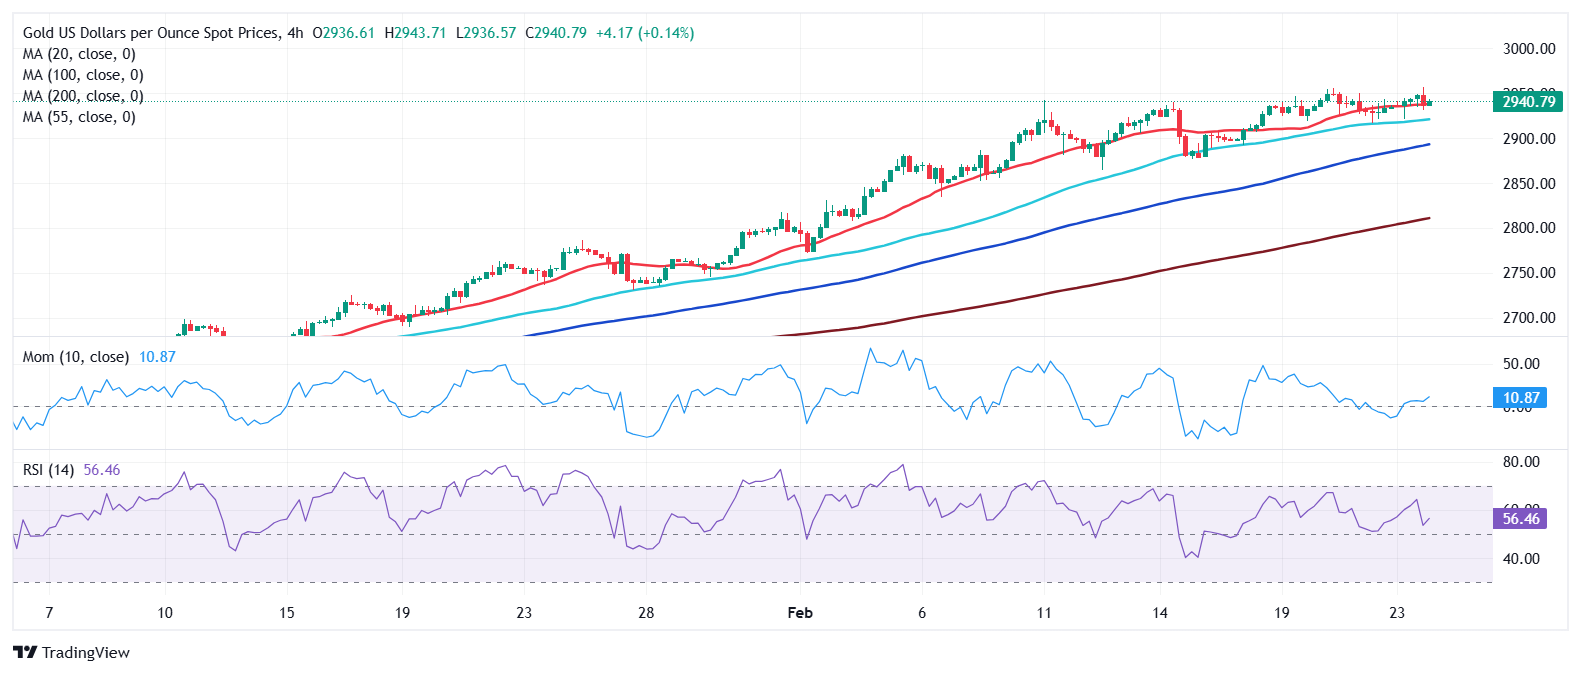
In the near term, and according to the 4-hour chart, XAU/USD trades above a flat 20 SMA, while the 100 and 200 SMAs head firmly north far below the current level. Technical indicators, in the meantime, turned south, with the Momentum crossing its midline into negative territory. Still, buyers are taking their chances on dips, limiting the bearish potential of Gold.
Support levels: 2,934.70 2,924.10 2,913.05
Resistance levels: 2,960.00 2,975.00 2,990.00