Since our last report Gold’s price, despite some ups and downs remained relatively stable. In today’s report we are to discuss mainly fundamental issues and we intend to end the report with a technical analysis of Gold’s daily chart.
Gold’s correlations being inactive
In contrast to gold’s stability the USD has been on the rise over the past week, implying that the negative correlation of the two trading instruments has been interrupted. At the same time, we note that despite a drop of US yields last Wednesday, they regained traction, and US yields are currently near the same level, they were in our last report. In general, we would note that the negative correlation of US yields with gold’s price is also inactive. Last but not least we would like to note the rally of silver’s price which also comes into contrast with gold’s stability disproving, at least at the current stage, the notion of a positive correlation of the gold’s price with silver’s price. Nevertheless, should we see the negative correlation of the USD with gold’s price reviving, any strengthening of the USD could weigh on gold’s price and the contrary.
The release of the US June CPI and PPI rates
As these lines are written, the US CPI rates for June are still to be released and together with the release of the PPI rates could shake gold’s price. The release is expected to show an acceleration of the CPI and PPI rates for the past month, implying a persistence of inflationary pressures in the US economy. Such a persistence of inflationary pressures could ease further, any market expectations for the Fed to cut rates until the end of the year could weaken. Please note that currently, market expectations are for the bank to cut rates twice until the end of the year once in September and a second time on December. Hence should we see the US June CPI and PPI rates accelerating beyond market expectations, we may see the releases weighing on gold’s price and vice versa.
The Fed’s intentions
Continuing the last paragraph’s analysis, we zoom in on the Fed’s intentions in this one. The release of the Fed’s last meeting minutes, last Wednesday, showed that Fed policymakers seem to maintain dovish expectations and expects the bank to ease its monetary policy. On the other hand we have to also note that Fed policymakers seem not to be of the same opinion in regards to extent of the bank’s monetary policy easing and its timing. Furthermore, we also note the rumors of a possible resignation of Fed Chairman Powell, yet we see this scenario as possibly remote at the current stage. Yet should such rumors intensify we may see the market’s dovish expectations growing which in turn could support gold prices.
Trump’s trade wars continue
US President Trump continued with his trade wars, threatening to levy a 30% tariff on imports entering US soil from the EU and Mexico, from August 1st onwards. Letters announcing the US intentions were sent on Saturday to the two sides. The US intentions were characterised by the EU and Mexico as unfair and efforts are still being made for a possible solution to the problem yet market hopes for such a scenario may have been weakened. Overall, the markets seem to be less sensitive to US President Trump’s trade wars and despite the issue still being fundamentally important, seems to be generating little movement in the markets currently. It may take substantial, unexpected developments for the markets to react on the issue. Should we see the issue intensifying substantially the markets’ worries for the possible outcome of Trump’s trade wars, we may see gold’s price getting some support as the shiny metal may get safe haven inflows.
Technical analysis
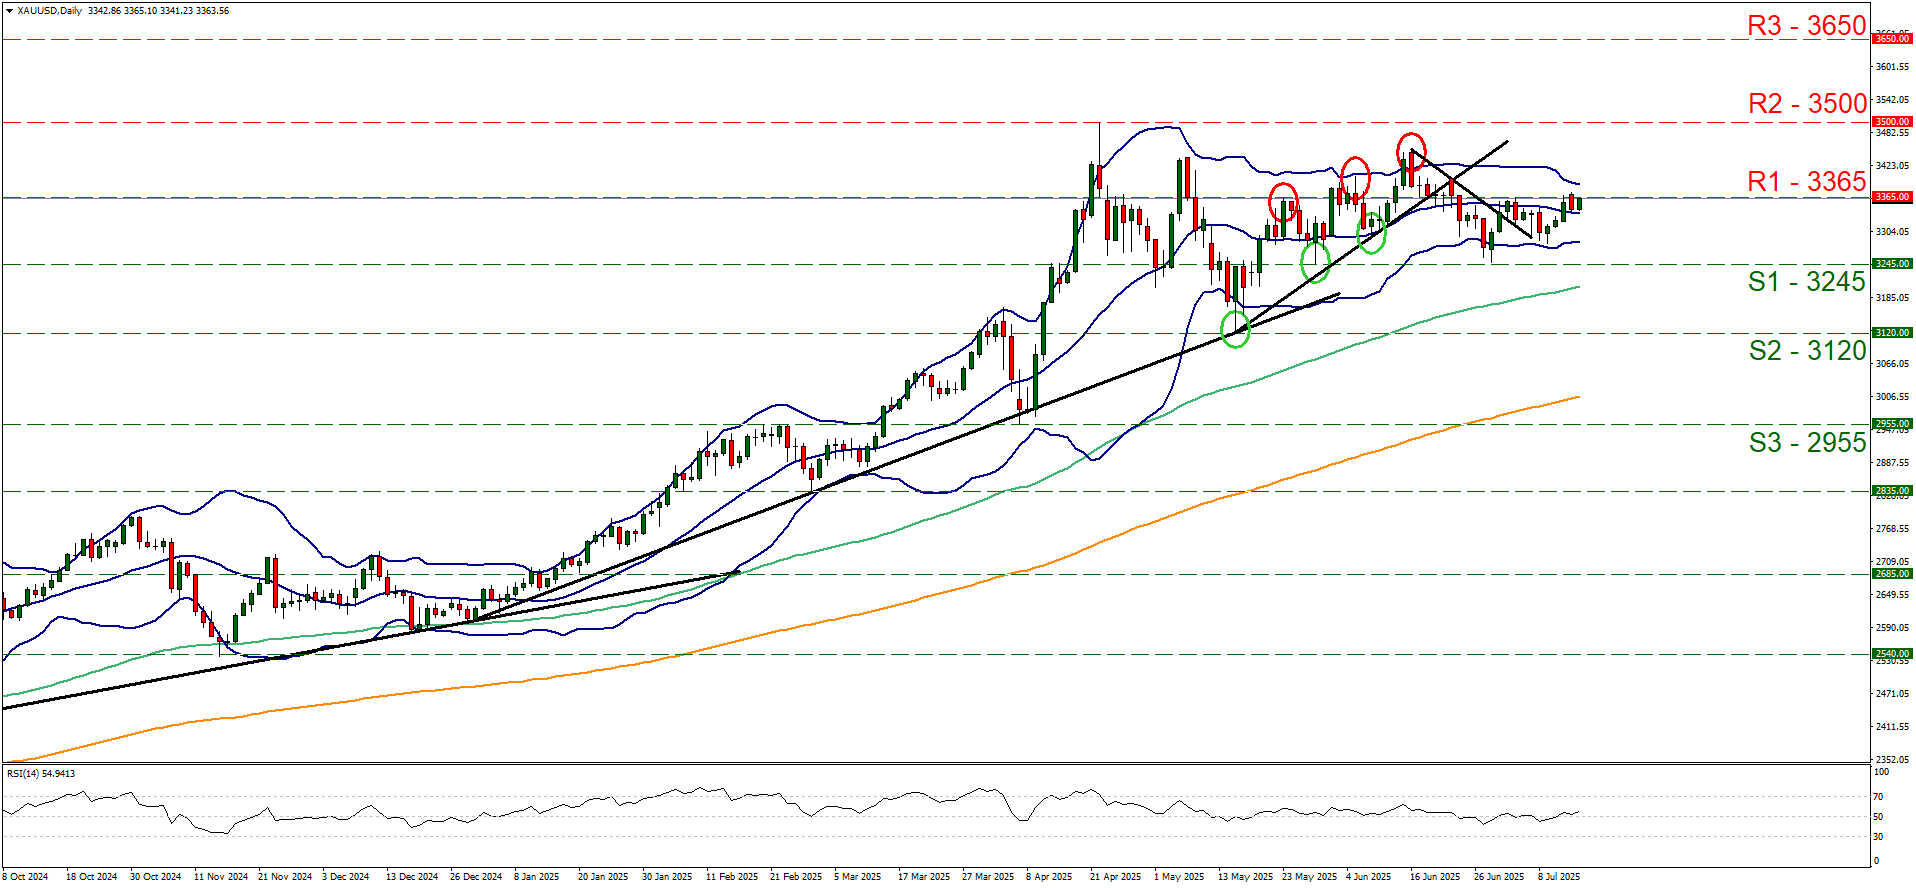
XAU/USD daily chart
Support: 3365 (S1), 3500 (S2), 3650 (S3).
Resistance: 3245 (R1), 3120 (R2), 2955 (R3).
Gold’s price remained in a sideways motion just below the 3365 (R1) resistance line, constantly testing the R1 level. The RSI indicator continues to run along the reading of 50 implying a relatively indecisive market for the precious metal’s direction. Furthermore, we note the narrowing of the Bollinger bands, which implies an easing of volatility for gold’s price which could allow the sideways motion to continue. Hence we maintain our bias for the sideways direction to be maintained at the current stage. Yet we note that the price action as noted at the start is constantly testing the R1, which in turn may imply some bullish tendencies. Yet, for a bullish outlook we would require a clear break above our 3365 (R1) resistance line with the next possible target for the bulls being the 3500 (R2) resistance level, which is also a record high level for the precious metal’s price. On the flip side, for a bearish outlook we would require a clear break below the 3245 (S1) support line with the next possible target for the bears being the 3120 (S2) support level.