Gold prices (XAU/USD) remain stable as investors navigate economic and geopolitical concerns. Market participants are closely monitoring developments that could drive further price appreciation. A global shift toward safe-haven assets supports the yellow metal’s bullish tone.
Impact of trade war and Fed policies
The recent announcement by the US government of a 25% tariff on imported cars and light trucks has intensified concerns about a global trade war. This move increases market uncertainty and fuels demand for safe-haven assets like gold. Investors fear that retaliatory measures from other nations could disrupt international trade, leading to volatility in financial markets.
At the same time, the Federal Reserve’s potential rate-cutting cycle adds another layer of support to gold prices. The US central bank is expected to reduce interest rates in response to slowing economic growth. Lower interest rates decrease the opportunity cost of holding non-yielding assets like gold, making it more attractive to investors.
The US Dollar (USD) has also pulled back from a three-week high, further supporting gold’s upward momentum. A weaker USD makes gold more affordable for foreign investors, increasing its demand. However, hopes for economic stimulus from China and a rise in US Treasury bond yields could limit gains in gold prices. Moreover, the release of US GDP data has pushed gold to new record levels. The fundamental data from the US does not alter the economic uncertainty caused by the tariffs.
Ascending channel signals ongoing bullish momentum
The gold price chart indicates an ascending channel, suggesting a bullish trend. The price action remains within the channel, with higher highs and higher lows confirming upward momentum. The channel’s lower boundary acts as a strong support level, preventing sharp declines.
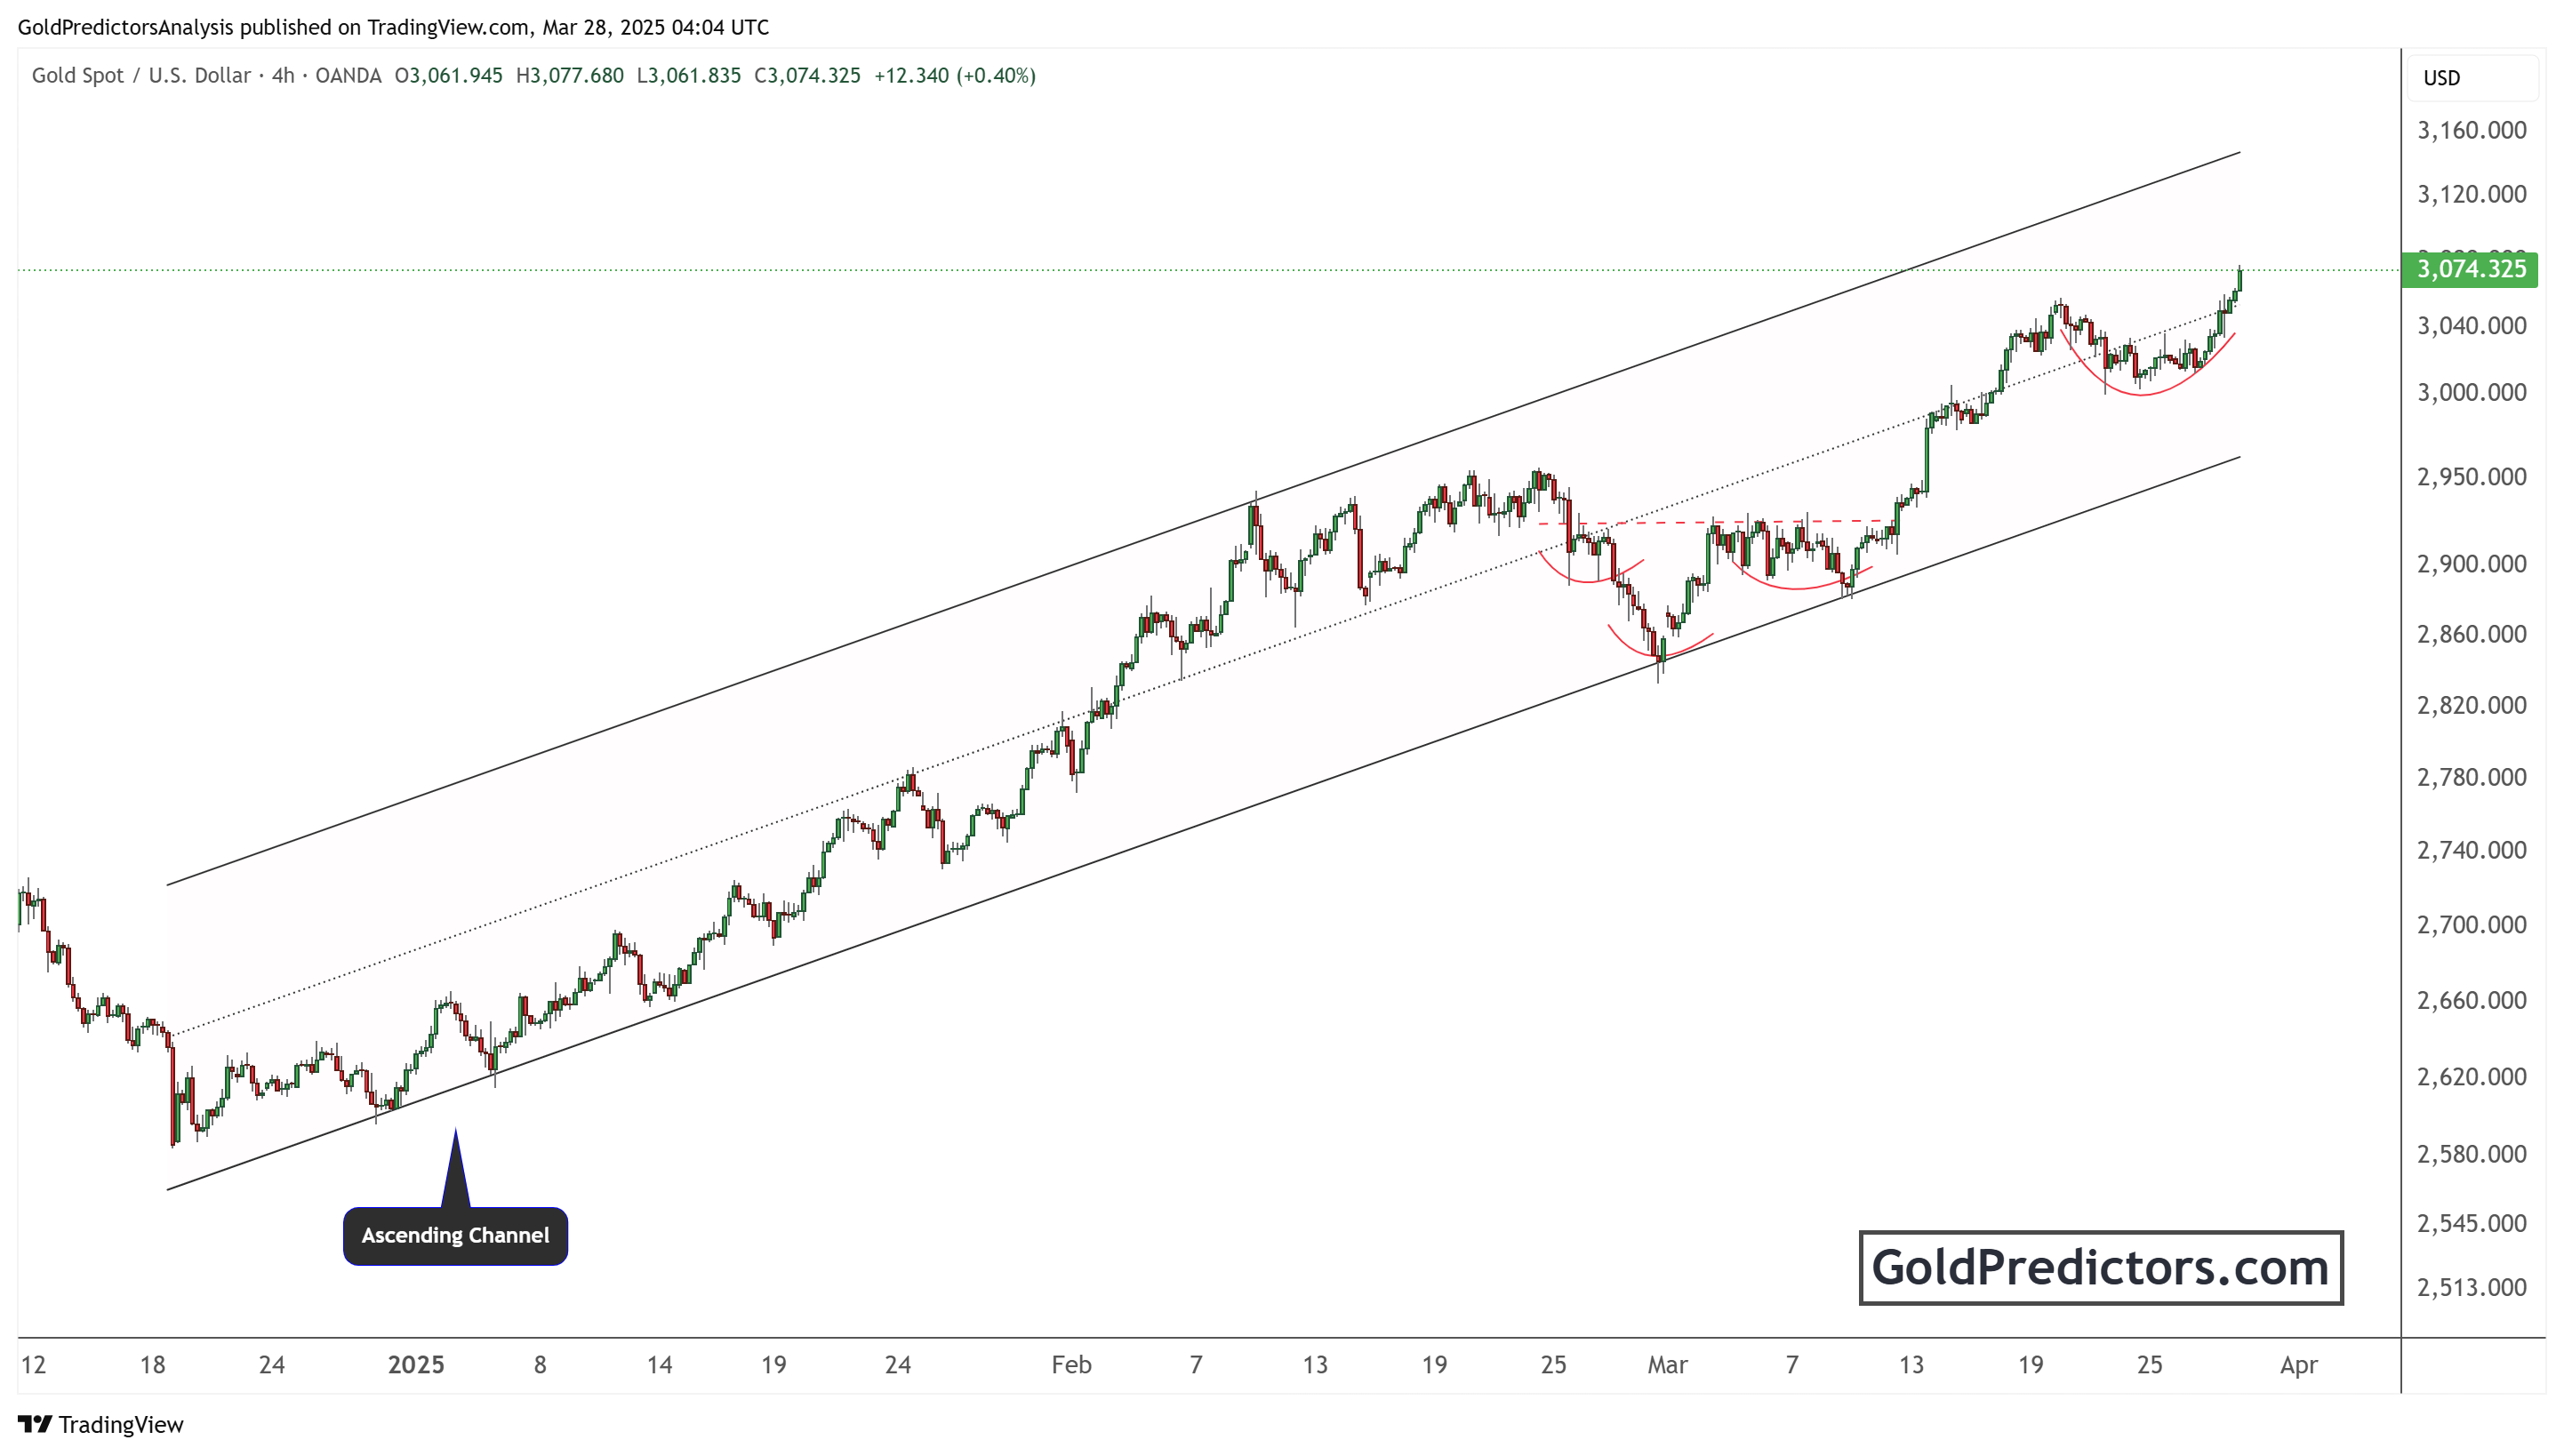
The price has formed an inverted head and shoulders pattern, followed by a cup pattern, and then broke higher. This price action indicates strong bullish momentum, suggesting a move toward the upper boundary of the ascending channel. Therefore, the price remains within the uptrend and is moving toward the $3,200 region.
The resistance is near the channel’s upper boundary, around the $3,120 level. A breakout above this level could accelerate further gains. On the other hand, a drop below $2,900 would signal a potential trend reversal.
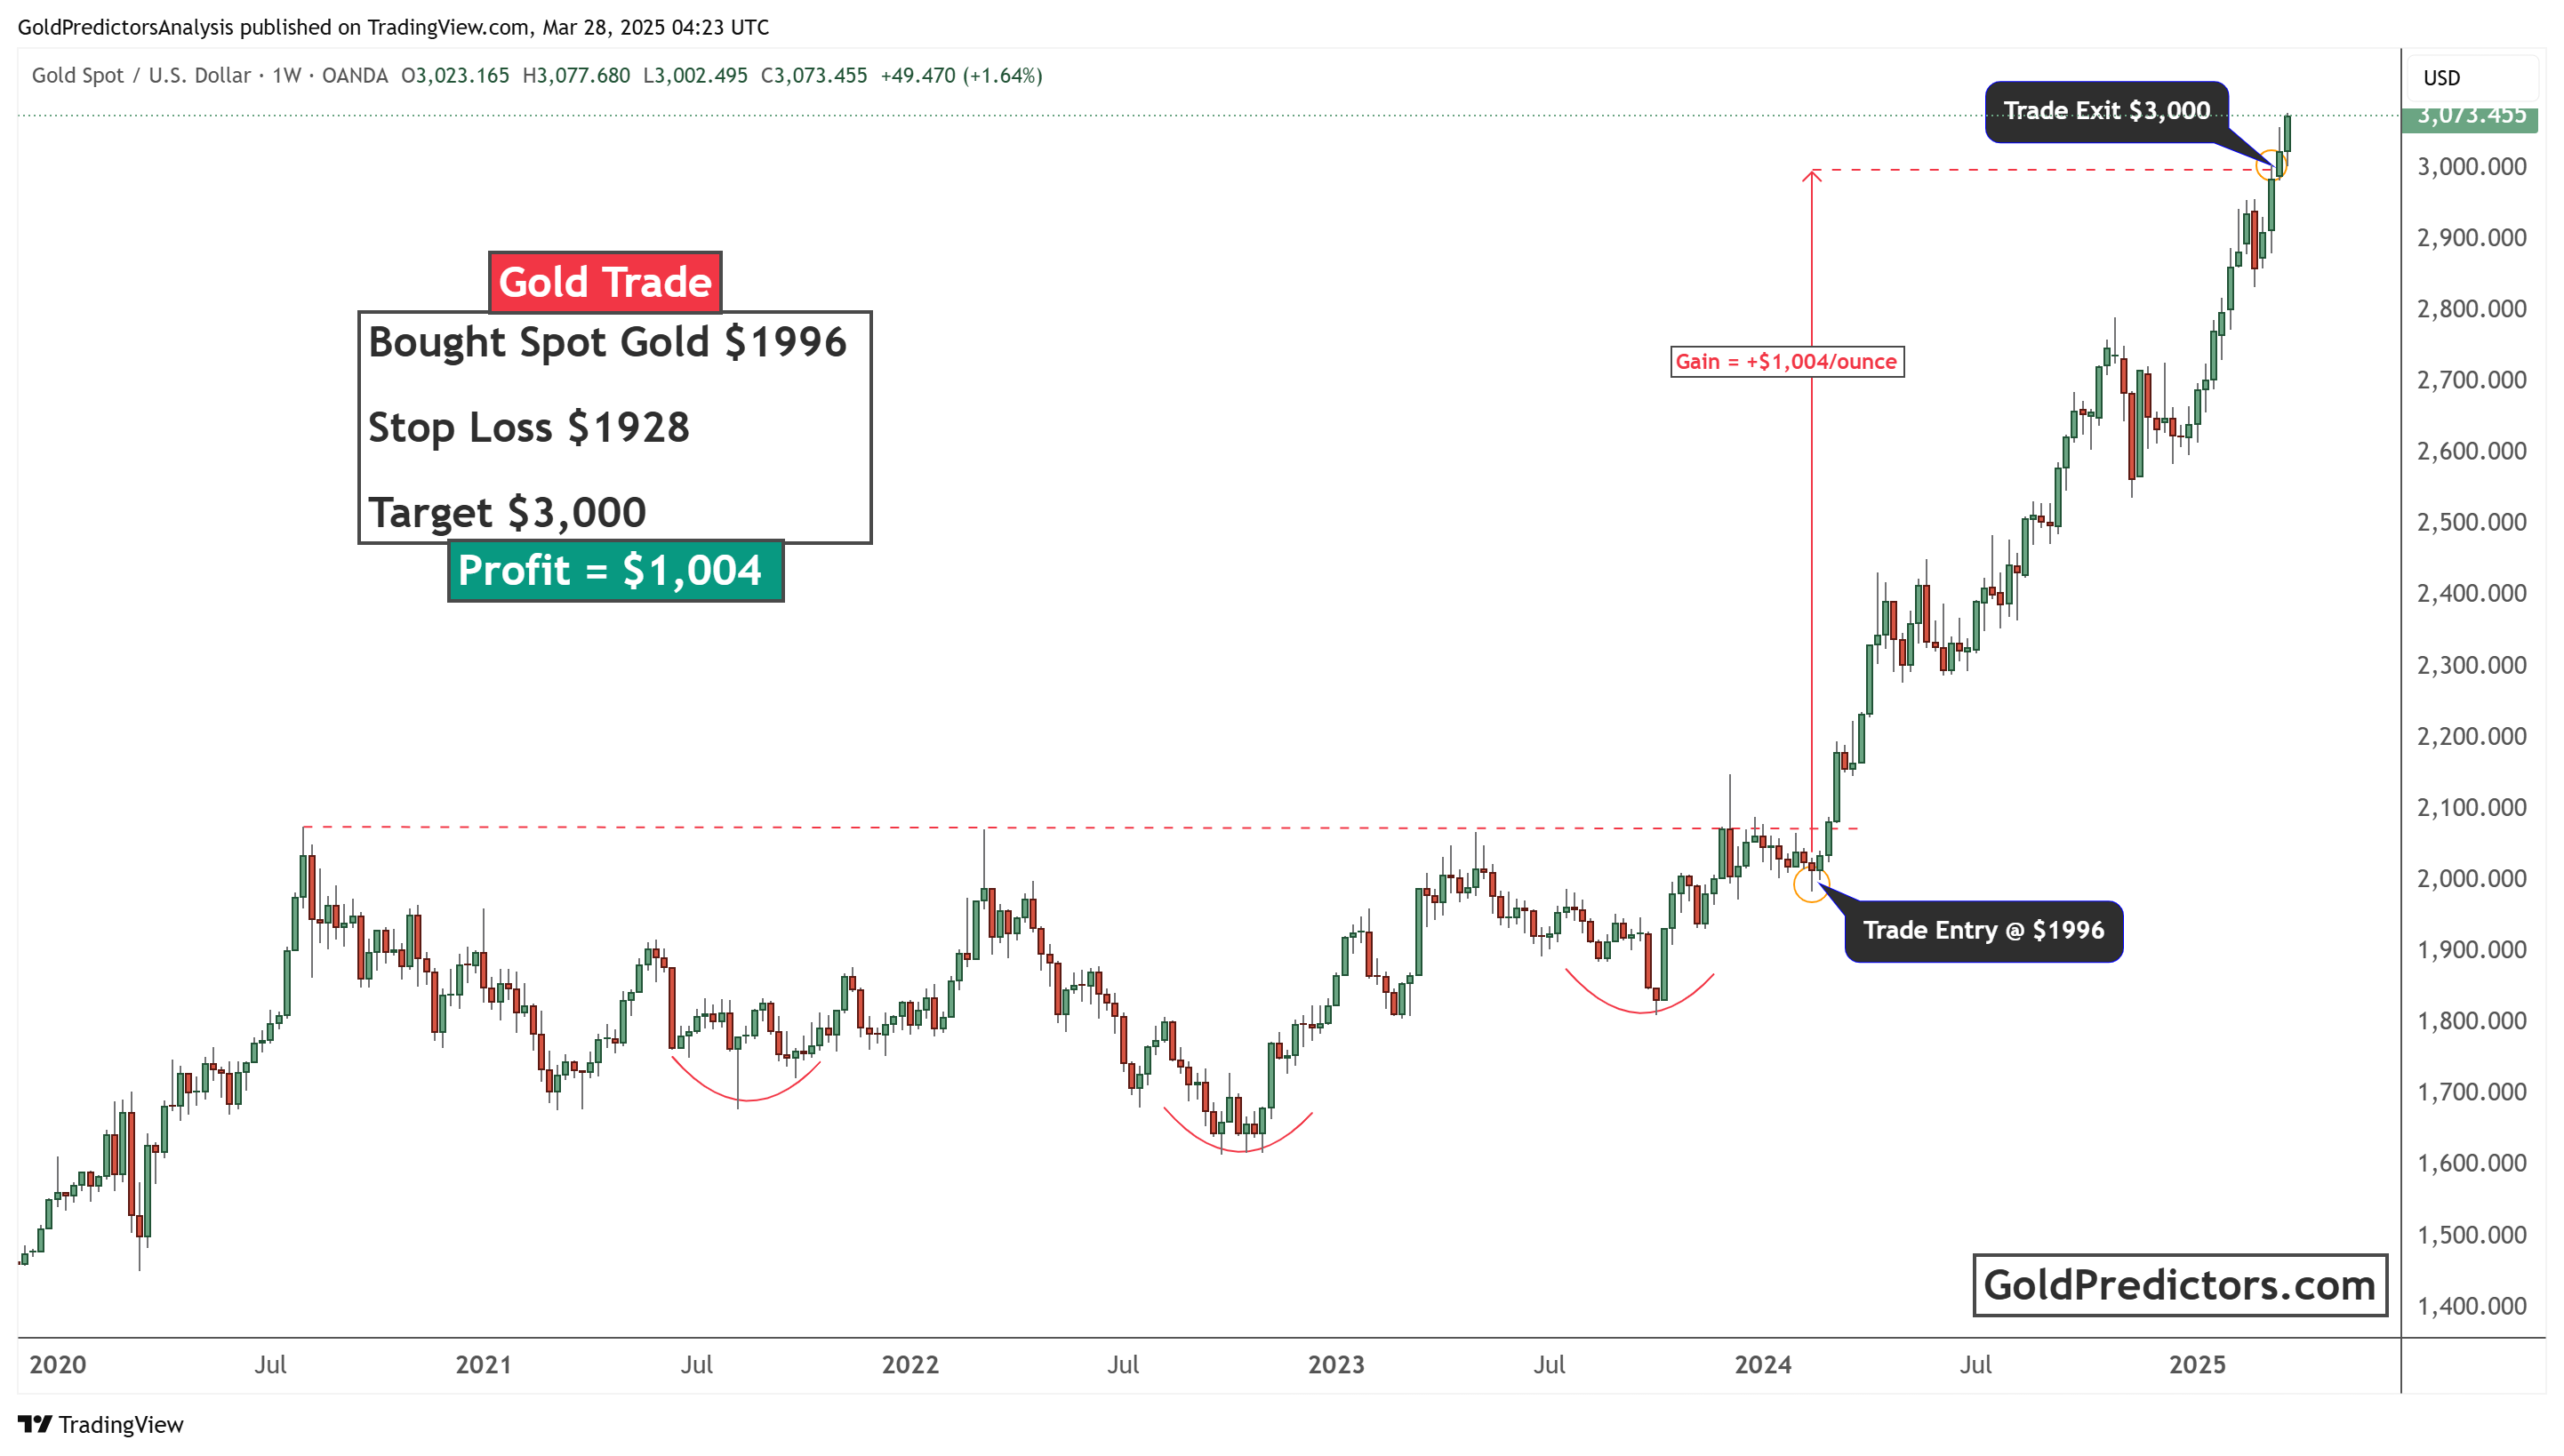
How to trade Gold during economic uncertainty?
This chart shows a successful gold trade strategy. The trade was executed at $1,996 with a stop loss of $1,928. The target price was $3,000, and the trade exited at that level. The price movement followed an inverted pattern of head and shoulders before breaking out. This trade was shared via WhatsApp with premium members of Gold Predictors. The trade earned a profit of $1,004 per ounce. The chart highlights the importance of setting clear entry, exit, and stop-loss levels.
Conclusion
In conclusion, gold benefits from rising economic and geopolitical uncertainty, supported by technical strength and safe-haven demand. The breakout from bullish chart patterns and the ongoing uptrend within the ascending channel suggest further upside toward $3,200. Trade tensions, potential Fed rate cuts, and a weakening US dollar reinforce gold’s bullish outlook. However, resistance is near $3,120, and external macro factors could limit short-term gains. Investors should monitor key levels and remain cautious while navigating this volatile environment.