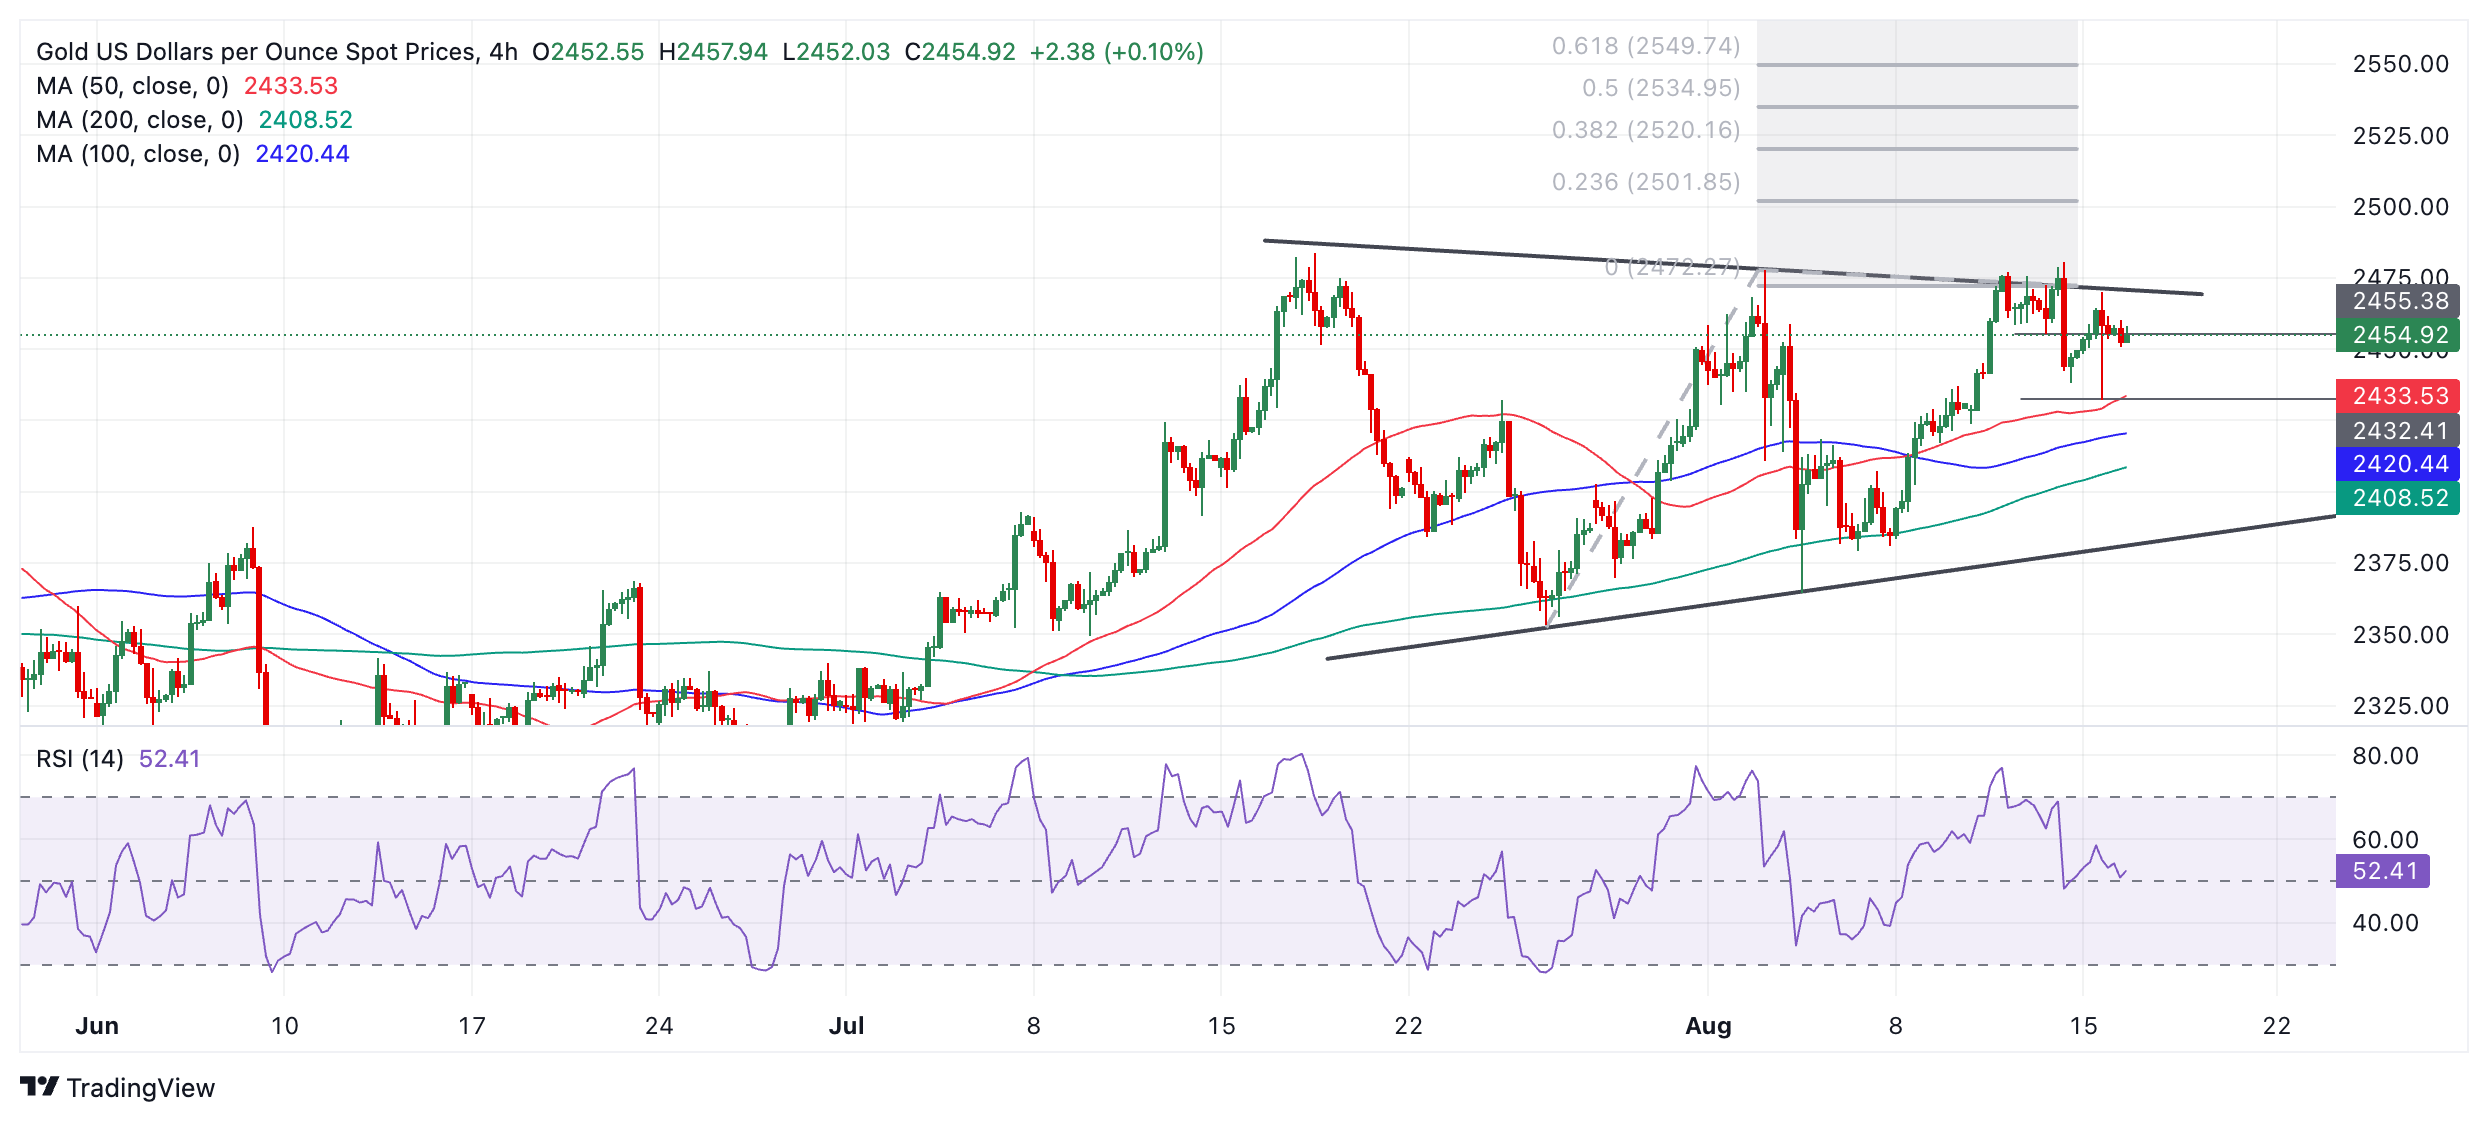
- Gold has corrected back from chart resistance in the $2,470s after the release of strong US retail sales data.
- Lower US initial jobless claims brought more positive news about the US economy, helping to dispel recession fears.
- The precious metal is probably unfolding a leg down within a sideways trend.
Gold (XAU/USD) swings between mild gains and losses in the $2,450s on Friday. The precious metal is in the midst of a retreat from a key chart resistance line in the $2,470s, which it had been battling with for most of the earlier part of the week.
The pullback was caused by better-than-expected US Retail Sales data released Thursday, which came out at 1.0% month-over-month in July, roundly beat economists estimates of 0.3%, and signaled a turnaround from June’s downwardly-revised 0.2% drop.
The enduring strength of the US consumer eased concerns the US economy might be entering a recession, fears that plagued markets at the start of August. Gold’s safe-haven status means it is actually losing value due to the less pessimistic outlook engendered by the data.
Gold bulls sound the horn after strong US data
Gold has been losing ground after the release of stronger-than-expected US macroeconomic data on Thursday. This not only brought into question the view that the US economy was at risk of entering a recession but also strengthened the US Dollar (USD) which Gold is mainly priced in, and readjusted investor expectations for the future path of interest rates in the US. The stronger data suggests the US Federal Reserve (Fed) may need to keep interest rates higher for longer, a negative scenario for Gold because it is a non-interest paying asset.
Analysts differ as to the overall significance of the strong data. Ulrich Leuchtmann, Head of FX Research at Commerzbank, cautions against reading too much positivity into it because Retail Sales is a lagging economic metric.
“In a hypothetical coming recession, the US labor market would certainly only suffer damage with a time lag. And it is only then that the US consumer typically notices,” says Leuchtmann.
“Do you remember Tom & Jerry? In the cartoon, you often see Tom the cat running over a cliff and continuing to run in the air for a moment before crashing all the harder. If the US economy were to slide into recession in the near future, it seems plausible to me that US retail sales would show a similar behavior,” he adds.
Economists at Capital Economics on the other hand, are more positive, headlining their note “Don’t bet against the US Consumer.”
“There was almost nothing in the July retail sales report for the perma-bears to latch on to,” they said in the report. “That increases the likelihood that the Fed will kick off its loosening cycle with a 25 bp cut in September, rather than a 50 bp move as markets were recently pricing in,” it adds.
US Jobs market also shows signs of resilience
In addition to the strong US Retail sales data, further data out on Thursday also showed US Initial Jobless Claims declining to 227K from an upwardly revised 234K, indicating a rebound in the jobs market – a further positive for the US economy.
Capital economics puts the encouraging jobs data down to the rapid reversal of temporary negative factors – Hurricane Beryl and the temporary shutdown of auto factories in Michigan.
Technical Analysis: Gold steps back from range ceiling
Gold is pulling back from the range ceiling it was pushing up against for most of the earlier part of the week. The short-term trend is probably sideways and, given “the trend is your friend”, is more likely than not to extend in that direction – oscillating within its range.
XAU/USD 4-hour Chart
Gold appears to have begun a fresh down leg within the range. It will probably now move down to $2,400, perhaps even reaching the range floor in the $2,390s. Due to the fact the range is tapering slightly, it might also be seen as a triangle pattern in the latter stages of development. A break below $2,432 (August 15 lows) would help provide additional bearish confirmation the down leg was evolving.
It is possible that the pair could breakout higher, continuing the longer-term bullish trend that was in play prior to the formation of the range. A decisive break above the range ceiling would be required, however, to confirm such a development. An upside breakout would then be expected to reach $2,550, a fresh all-time high, calculated by taking the 0.618 Fibonacci ratio of the range’s height and extrapolating it higher.
A decisive break would be one characterized by a long green candle that pierced clearly through the level and closed near its high, or three green candles in a row that breached the level.
Economic Indicator
Retail Sales (MoM)
The Retail Sales data, released by the US Census Bureau on a monthly basis, measures the value in total receipts of retail and food stores in the United States. Monthly percent changes reflect the rate of changes in such sales. A stratified random sampling method is used to select approximately 4,800 retail and food services firms whose sales are then weighted and benchmarked to represent the complete universe of over three million retail and food services firms across the country. The data is adjusted for seasonal variations as well as holiday and trading-day differences, but not for price changes. Retail Sales data is widely followed as an indicator of consumer spending, which is a major driver of the US economy. Generally, a high reading is seen as bullish for the US Dollar (USD), while a low reading is seen as bearish.
Last release: Thu Aug 15, 2024 12:30
Frequency: Monthly
Actual: 1%
Consensus: 0.3%
Previous: 0%
Source: US Census Bureau


