
Gold price (XAU/USD) continues its upward momentum, reaching a fresh record high beyond the $2,950 level during the European session. The rally is fueled by concerns that US President Donald Trump’s proposed trade tariffs could escalate into a global trade war. This uncertainty has increased demand for safe-haven assets, including gold. Additionally, a decline in US Treasury bond yields has weakened the US dollar, providing further support to gold’s price movement.
Gold price continues to attract safe-haven flows amid Trump’s tariff plans
The prospect of new trade tariffs has injected volatility into global markets. Trump recently announced that he plans to impose significant tariffs on various imports, further raising fears of economic disruptions. US Commerce Secretary Howard Lutnick echoed Trump’s views, stating that the administration aims to reform trade policies to benefit domestic industries. Trump also hinted at a potential new trade agreement with China, but uncertainty remains high.
Meanwhile, the US dollar struggles to maintain its recent gains as Treasury yields continue their decline. The weakening dollar makes gold more attractive to investors seeking stability. Additionally, the Federal Reserve’s recent meeting minutes revealed a cautious stance on monetary policy, reinforcing expectations that interest rates will remain stable in the near term. This stance supports gold prices, as lower interest rates reduce the opportunity cost of holding non-yielding assets like gold.
The Federal Reserve’s Vice Chairman, Philip Jefferson, acknowledged the strength of the US economy but emphasized ongoing inflation concerns. Chicago Fed President Austan Goolsbee also highlighted that inflation remains elevated, suggesting that the central bank will keep rates steady before considering any cuts. These factors indicate prolonged economic uncertainty, which continues to drive safe-haven demand for gold. Market participants are closely monitoring upcoming economic reports, including initial jobless claims and the Philly Fed Manufacturing Index, which could provide additional market direction.
Technical analysis of Gold price chart
The chart below illustrates gold’s price action within a triangle formation. Gold has successfully broken above key resistance at $2,950, confirming bullish momentum. This breakout indicates the potential for further upside, with the next resistance level likely near the psychological $3,000 mark. A sustained move above this level could trigger a strong rally toward new highs.
Unlock exclusive gold and silver trading signals and updates that most investors don’t see. Join our free newsletter now!
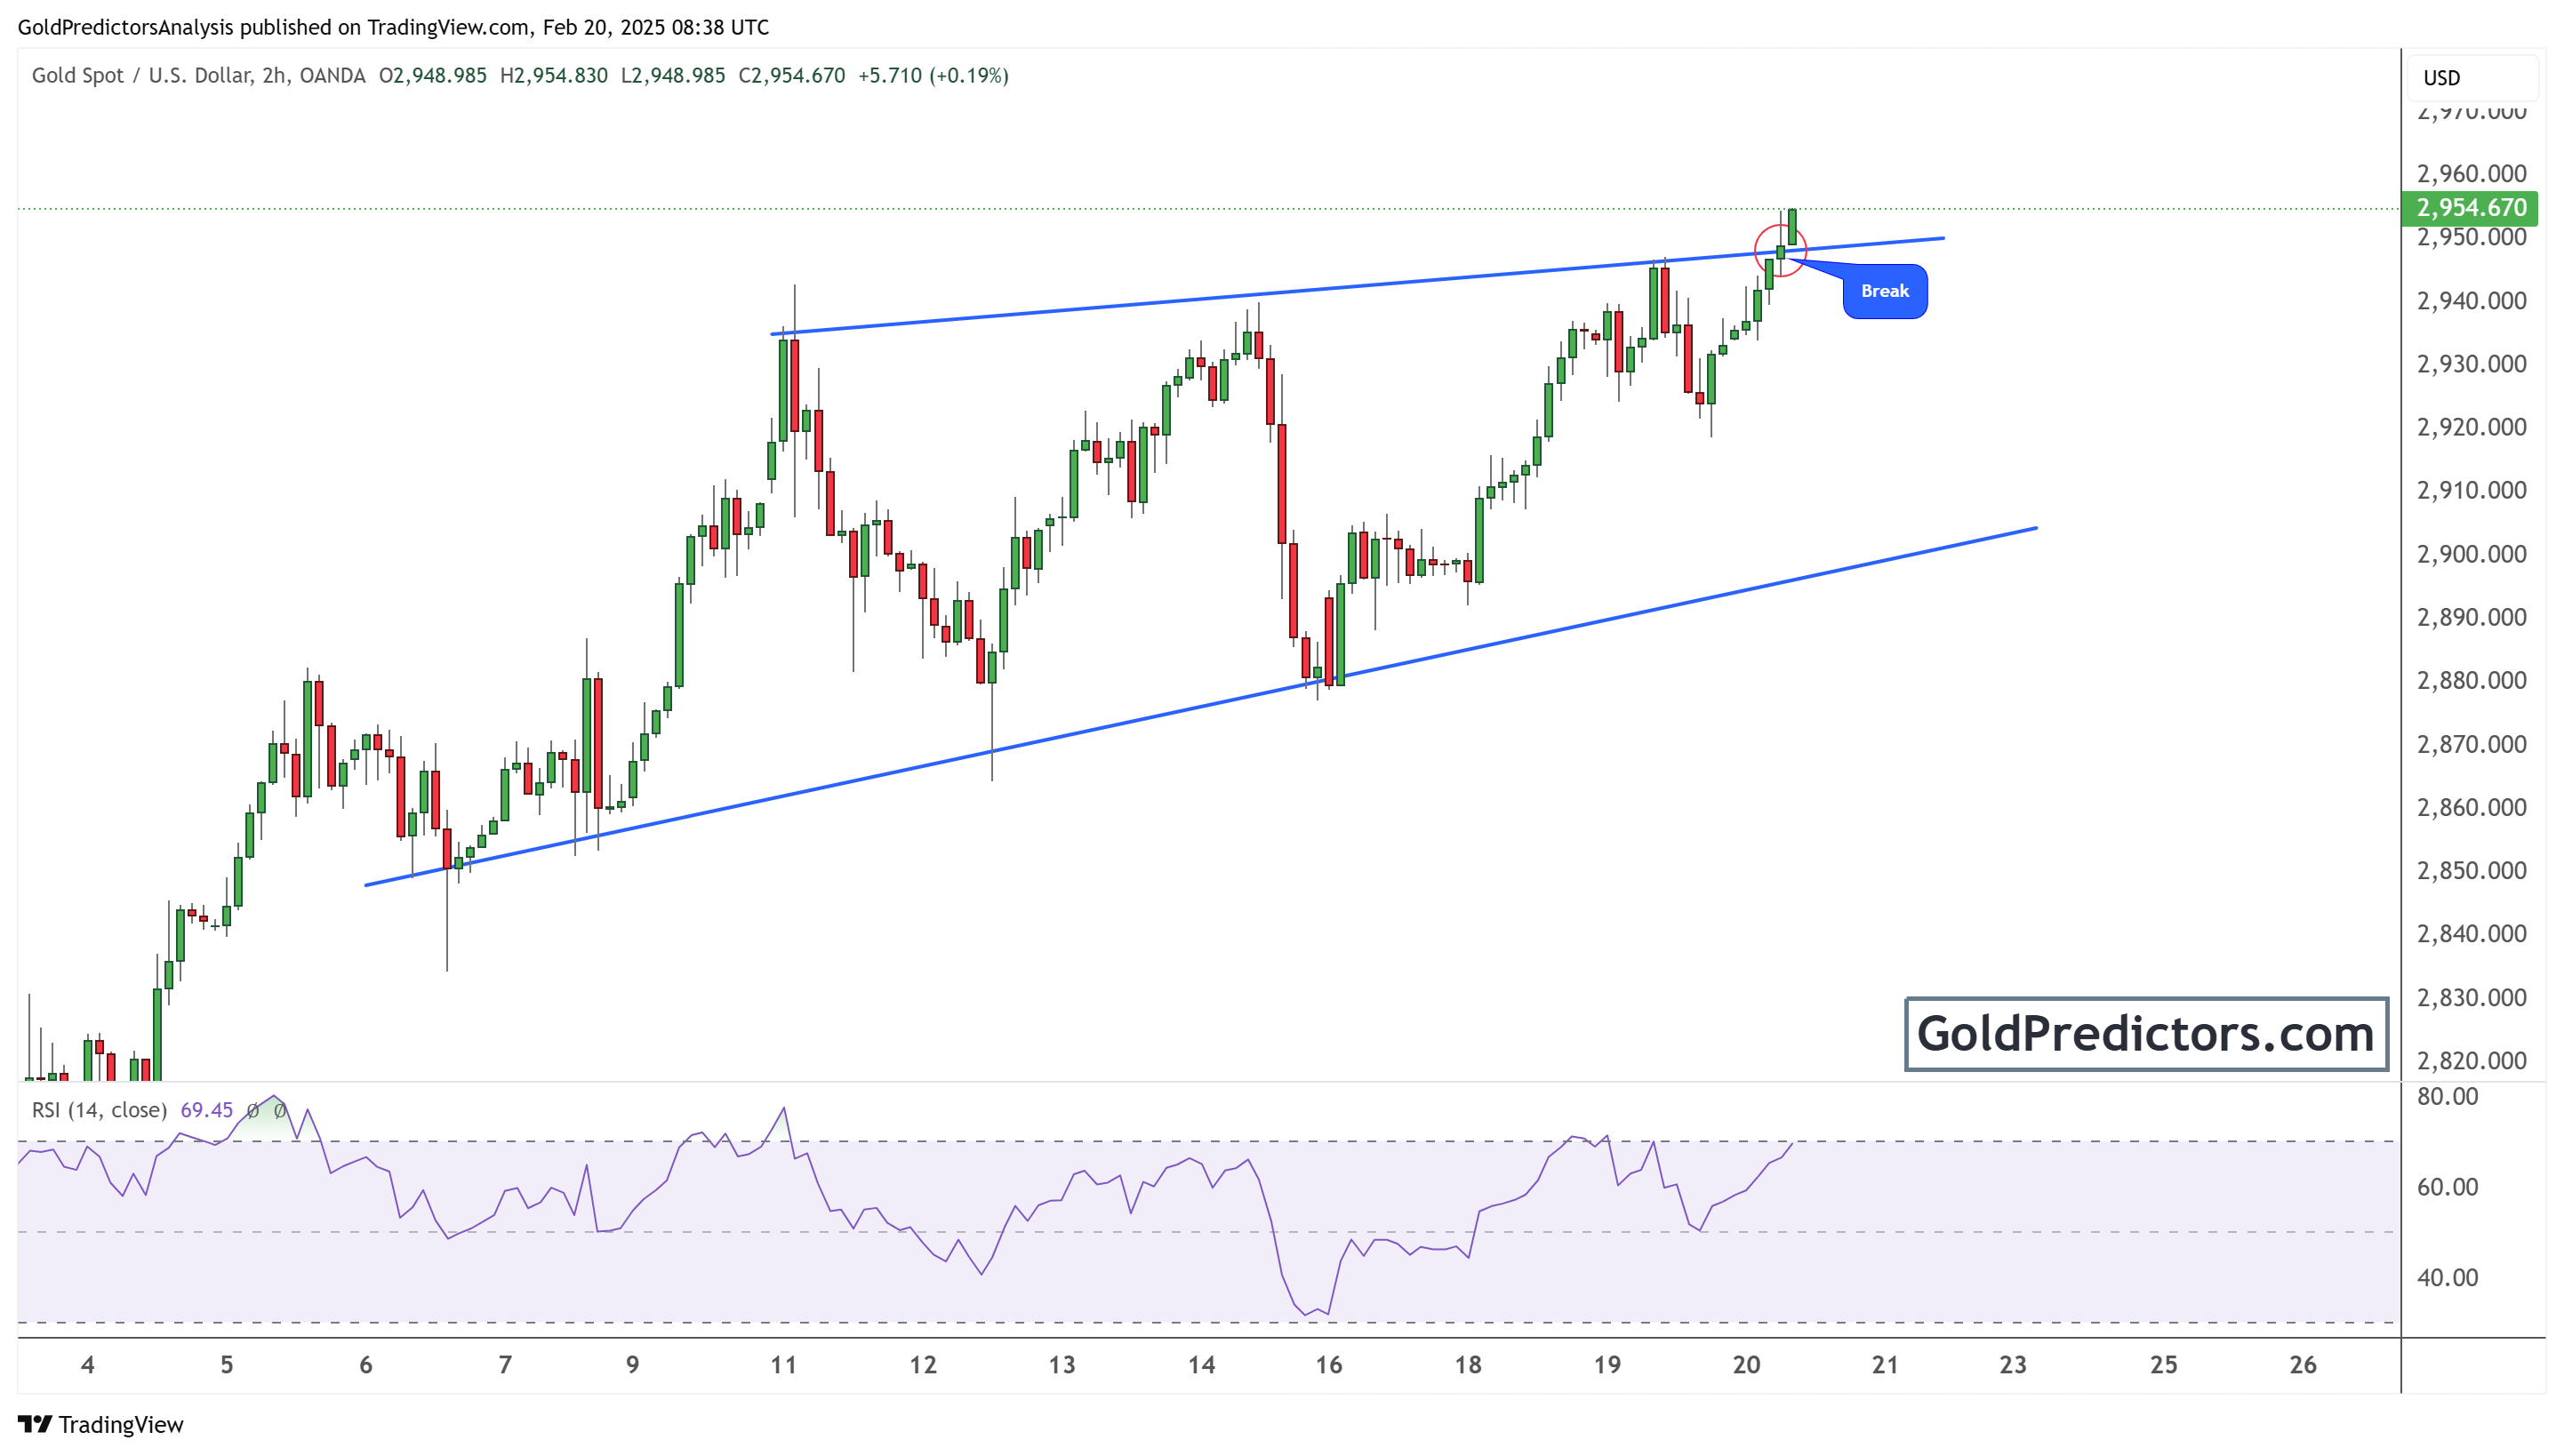
The Relative Strength Index (RSI) on the chart remains near overbought territory, suggesting that gold could face short-term consolidation before continuing its uptrend. However, the overall technical outlook remains positive as long as the price holds above the broken resistance level. In case of a pullback, the first major support lies at $2,900, followed by the lower boundary of the ascending wedge near $2,880. If gold breaks below these levels, further downside corrections could be expected.
Conclusion
Gold’s recent rally highlights its role as a safe-haven asset during times of economic uncertainty. Concerns over Trump’s trade tariffs, a weakening US dollar, and a cautious Federal Reserve have all contributed to gold’s surge past $2,950. Technical indicators support a bullish outlook, with a potential breakout above $3,000. Traders should watch key levels and upcoming economic data releases to gauge gold’s next move. If risk sentiment remains fragile, gold could continue its upward trajectory in the coming weeks.
Unlock exclusive gold and silver trading signals and updates that most investors don’t see. Join our free newsletter now!