
Gold price remains volatile as geopolitical risks and policy signals compete for market attention. Rising tensions between Iran and Israel have boosted demand for safe havens, but gold has struggled to maintain its gains. The ceasefire agreement and falling oil prices have reduced inflation fears, limiting gold’s upside. Meanwhile, expectations of a US rate cut in July continue to influence market sentiment. Traders are watching key technical levels and upcoming Fed signals for the next significant move.
Gold price under pressure as Iran-Israel ceasefire weakens safe-haven demand
Gold price is attempting a modest recovery after hitting a nine-day low. The ongoing conflict between Iran and Israel has increased demand for gold as a haven. Over the weekend, US airstrikes targeted Iranian nuclear facilities. In response, Tehran launched missile and drone strikes on Israel, raising fears of a broader regional conflict.
Despite these tensions, gold remains under pressure. The announcement of a ceasefire between Iran and Israel has weighed on gold’s safe-haven appeal. US President Donald Trump and Iranian officials confirmed the ceasefire, easing immediate geopolitical concerns. At the same time, oil prices have retraced sharply. Lower oil prices reduce inflation expectations, limiting gold’s appeal as an inflation hedge.
However, expectations of a US rate cut in July are providing some support for the metal. Fed Governor Michelle Bowman and Fed official Christopher Waller have signaled openness to a rate cut as early as July. Bowman stated on Monday that she is “open to cutting rates if inflation stays contained,” while Waller echoed similar views last Friday. Market participants now see a 21% probability of a July rate cut, up from 14.5% last week.
Technical Analysis: Inverse Head and Shoulders Pattern Signals Key Levels
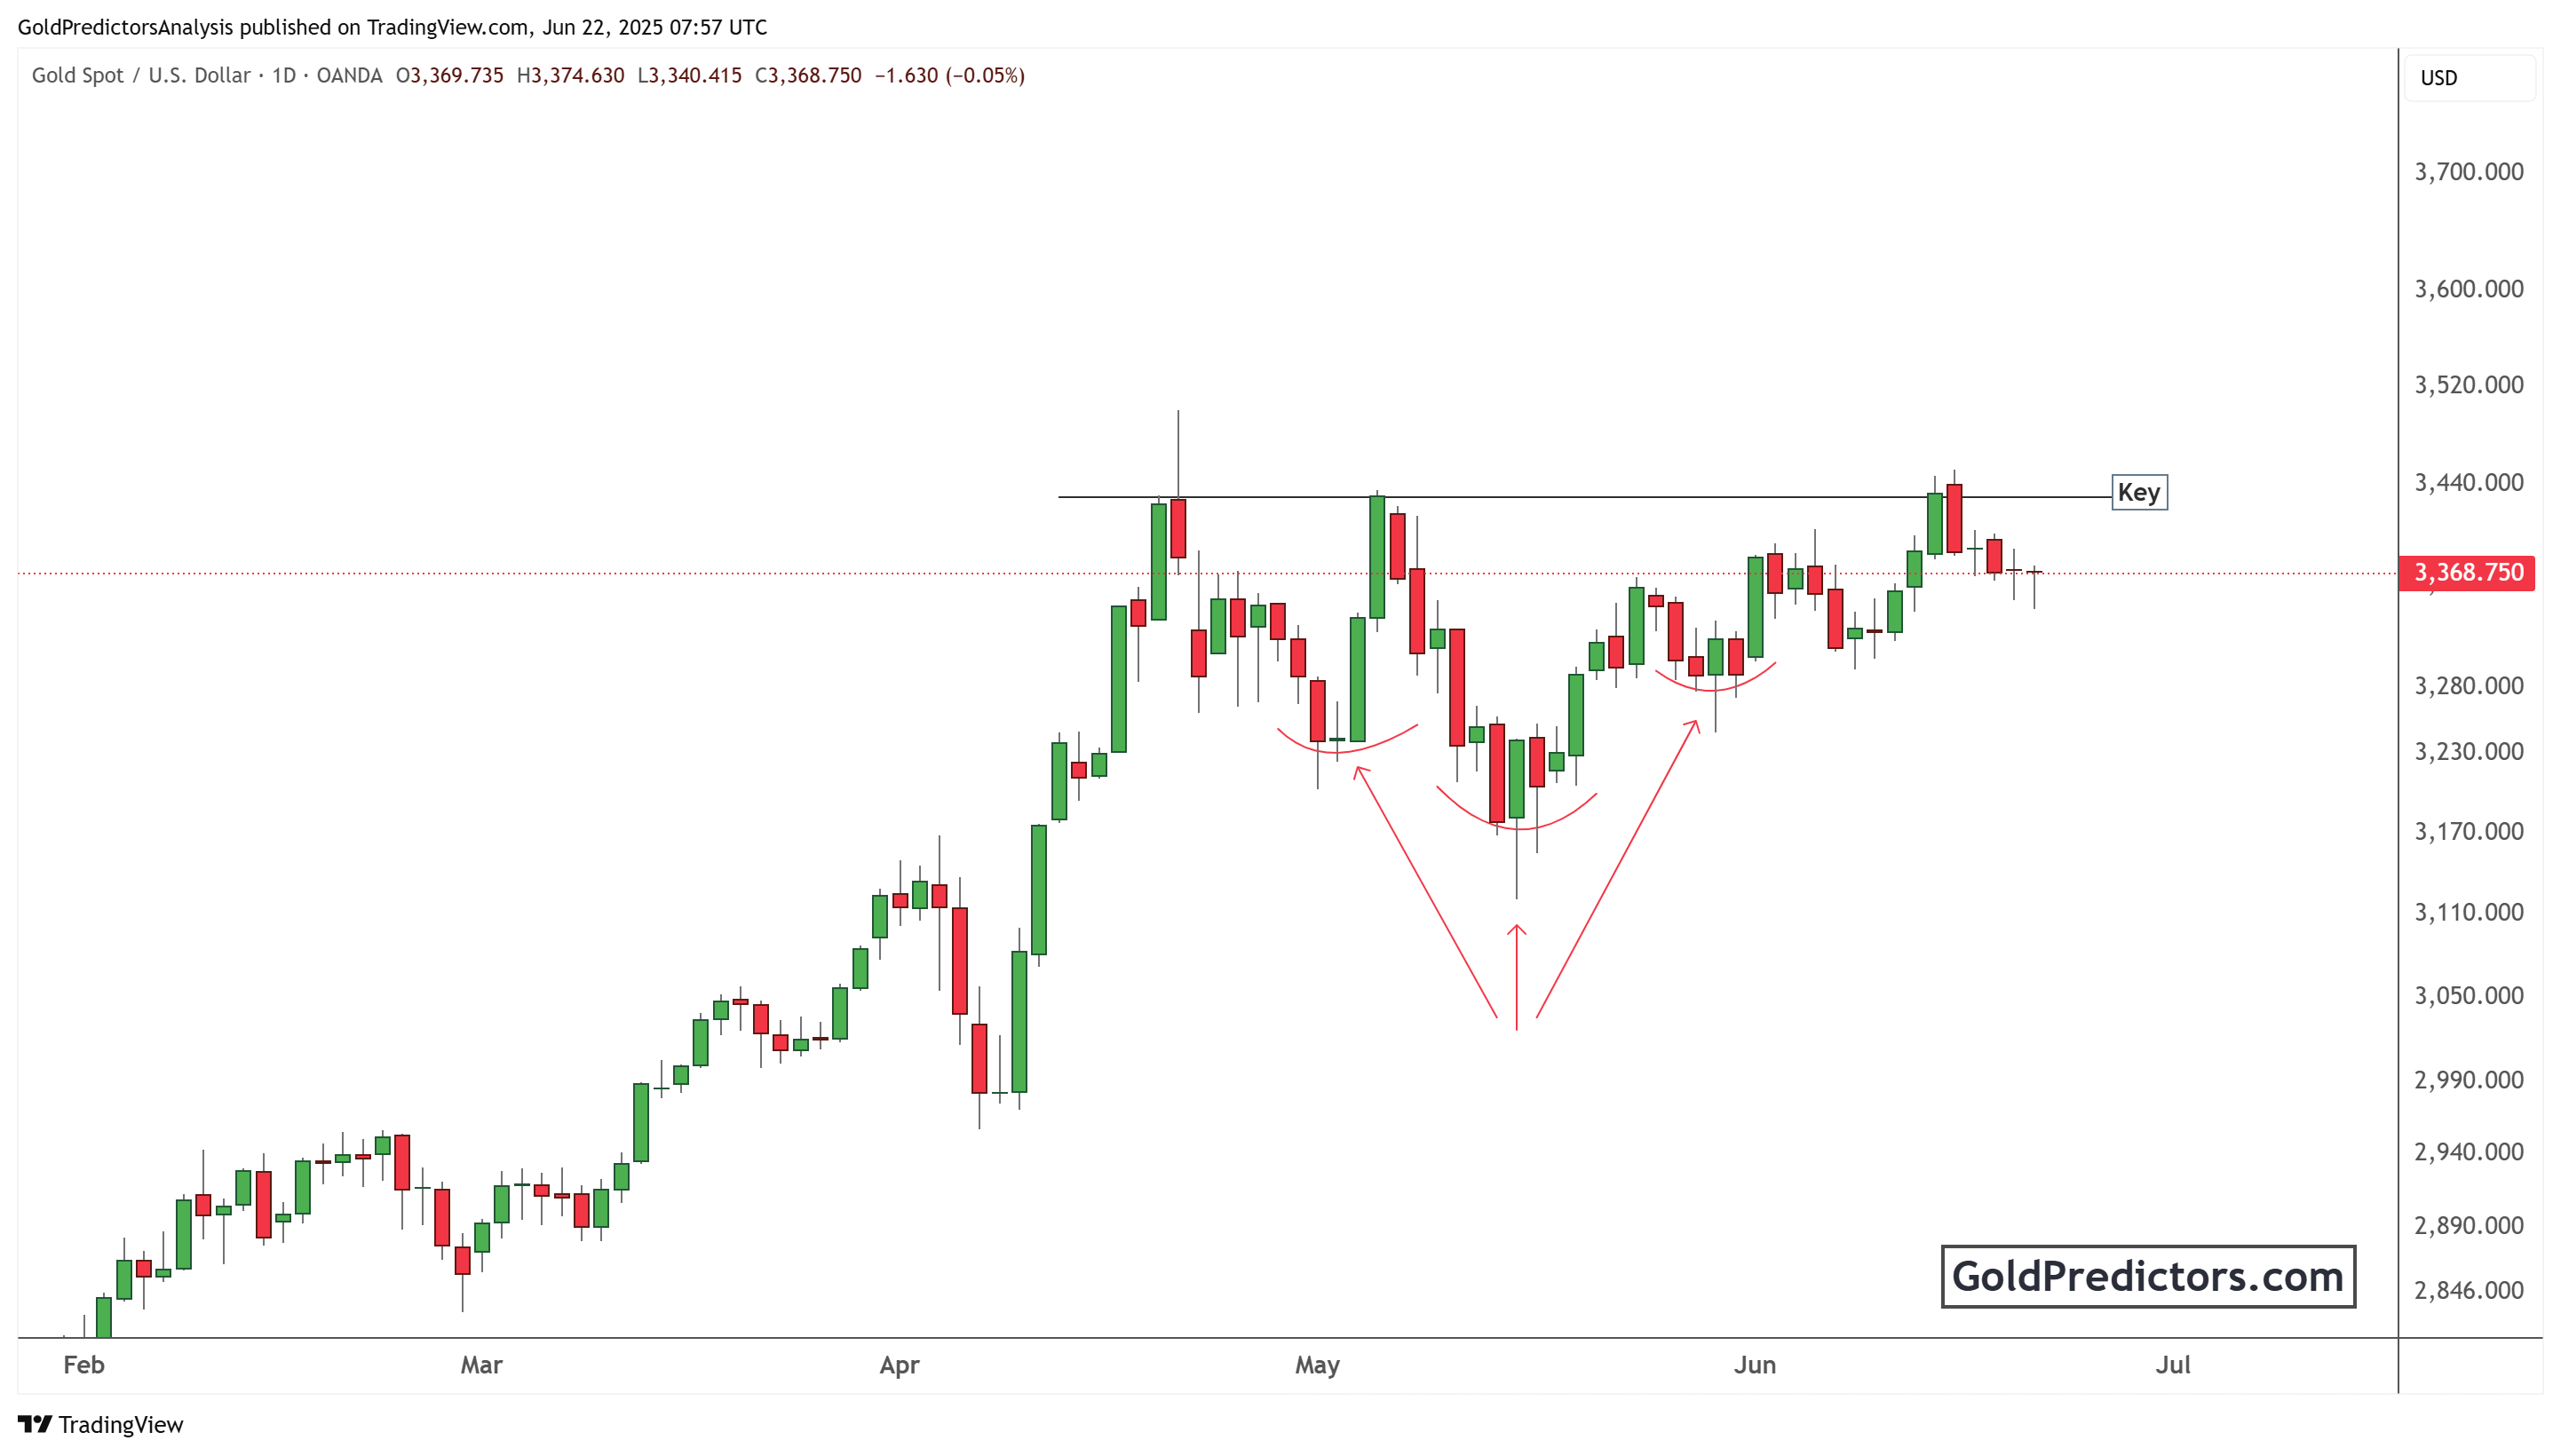
The gold chart below shows a classic inverse head-and-shoulders formation. This bullish reversal pattern developed over the past two months. The left shoulder formed in early May, followed by the head in mid-May. The right shoulder was completed in early June. The neckline of this pattern is visible near the $3,430 level. Gold recently broke above this neckline but failed to sustain the bullish breakout. Price is now hovering below this key resistance level.
Gold attempted to push higher but met intense selling pressure near $3,430. The rejection at this level signals a lack of bullish conviction. As a result, gold has pulled back for three consecutive days. Despite the recent weakness, gold remains above key support near $3,300. Holding above this level keeps the bullish reversal structure intact. A decisive break below $3,300 would invalidate the inverse head and shoulders pattern and expose gold to further downside.
For bulls to regain control, gold must reclaim the $3,430 resistance level. A sustained move above this level could trigger fresh buying interest and confirm the bullish reversal. In that scenario, gold may target the $3,520 and $3,600 levels next.
Conclusion
Gold price remains trapped between geopolitical tensions and policy expectations. The ceasefire between Iran and Israel has eased some safe-haven demand, but uncertainty lingers. Traders now focus on Fed Chair Powell’s testimony for fresh policy clues. A confirmed break above $3,430 could revive bullish momentum, while failure to hold $3,300 risks further downside. Market sentiment will stay fragile as global events unfold.
Unlock exclusive gold and silver trading signals and updates that most investors don’t see. Join our free newsletter now!