
-
Gold respects the $3,300 Fair Value Gap, signaling a possible bullish recovery if $3,360 gives way.
-
Supplementary Headline: Previous bearish play unfolds as expected, but failure to break key support suggests sellers may be exhausted.
-
Technical Forecast: Neutral bias with bullish potential above $3,315; bearish risk resumes if $3,300 fails.
Narrative: Bearish breakdown played out, but bulls defend $3.300
Previous forecast
Current
-1751956720549.png)
In our July 4 analysis – Gold price forecast: Bullish scenario begins to materialize & EUR/USD, Gold, Nasdaq, Bitcoin forecast and more, breakout trading setups – we outlined a potential bearish scenario developing around the $3,360–$3,370 premium distribution zone. The market played this scenario out perfectly—failing to sustain above the highs, breaking structure, and tapping into lower Fair Value Gaps.
However, while the initial sell-off confirmed our short-term bearish expectations, price action since then has not triggered a full reversal. Instead, gold has found support at a newly formed 4H Bullish Fair Value Gap around $3,300–$3,315, leaving the door open for bullish reaccumulation if key levels flip.
Key fundamental developments
Tariff delays reduce safe-haven urgency
The postponement of U.S. tariff implementation has calmed market fears, weakening immediate safe-haven demand for gold.
Central Bank demand and De-Dollarization persist
Despite the pullback, central banks remain steady buyers. The underlying bid from sovereign accumulation continues to support gold’s macro uptrend.
Fed stays neutral
Recent Fed speeches point to a patient stance on rates, which has reduced volatility but may still tilt gold bullish if inflation surprises to the upside.
Technical outlook
Gold is now caught between two zones:
-
Bearish Fair Value Gap Resistance at $3,330–$3,345
-
Bullish Fair Value Gap Support at $3,315–$3,330
This defines a tactical consolidation, where price must break either boundary to define the next directional leg.
Bullish scenario: Support holds and $3,360 breaks
-1751956738789.png)
Gold is currently testing off the 4H Bullish FVG at $3,315–$3,330, a potential bounce level. If we see bullish follow-through and break above the key $3,345–$3,360, we could see a new leg higher toward:
-
$3,370 – previous range high.
-
$3,400–$3,420 – expansion targets if FVGs form and hold on lower timeframes.
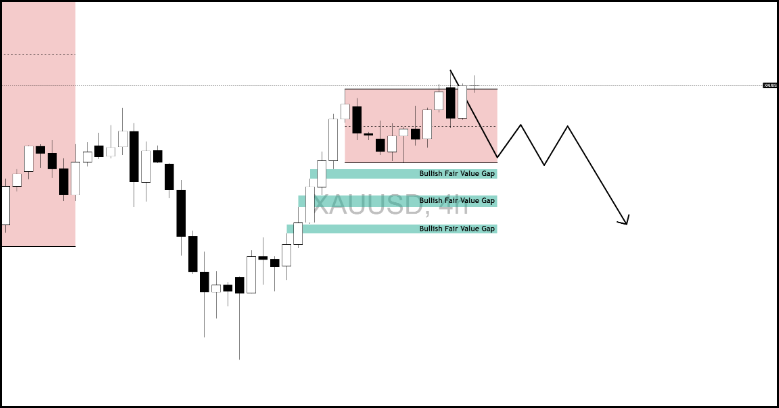
Bearish scenario: Rejection and structure shift below $3,300
-1751956746071.png)
If price fails to reclaim the bearish FVG at $3,330–$3,345, and sellers step in again with another lower high, a break below $3,300 would confirm bearish continuation, targeting:
-
$3,270 – next liquidity pool.
-
$3,250–$3,240 – deeper imbalance fill and trendline liquidity.
Key levels to watch
| Zone | Price Range | Market Implication | Bias |
|---|---|---|---|
|
Bullish Breakout |
$3,345–$3,360 |
Clean break and close above confirms bullish continuation |
Bullish |
|
Compression Zone |
$3,315–$3,330 |
Bullish FVG zone; active battleground between buyers/sellers |
Neutral / Pivotal |
|
Support Floor |
$3,300 |
Loss of this level opens bearish momentum toward liquidity |
Bearish Below |
|
Downside Targets |
$3,270 / $3,250 |
Break of $3,300 could target these liquidity and imbalance zones |
Bearish Target |
|
Liquidity Magnet |
$3,370 |
Previous high; likely area of buy-side liquidity sweep |
|