XAU/USD eyes $3,500 and WTI nears $85 on Israel-Iran escalation, while SPDR S&P 500 ETF and E-mini Nasdaq futures snap three-month rising wedges.
Macro overview
Escalating Israel-Iran hostilities have sparked a classic risk-off rotation: capital is pouring into safe-havens (gold, crude oil) while major equity benchmarks are fracturing long-standing technical structures. Below is a comprehensive breakdown of where each market stands, how it arrived at current levels, and what to watch next.
Gold: Safe-haven surge to $3,500
Technical context and recent moves
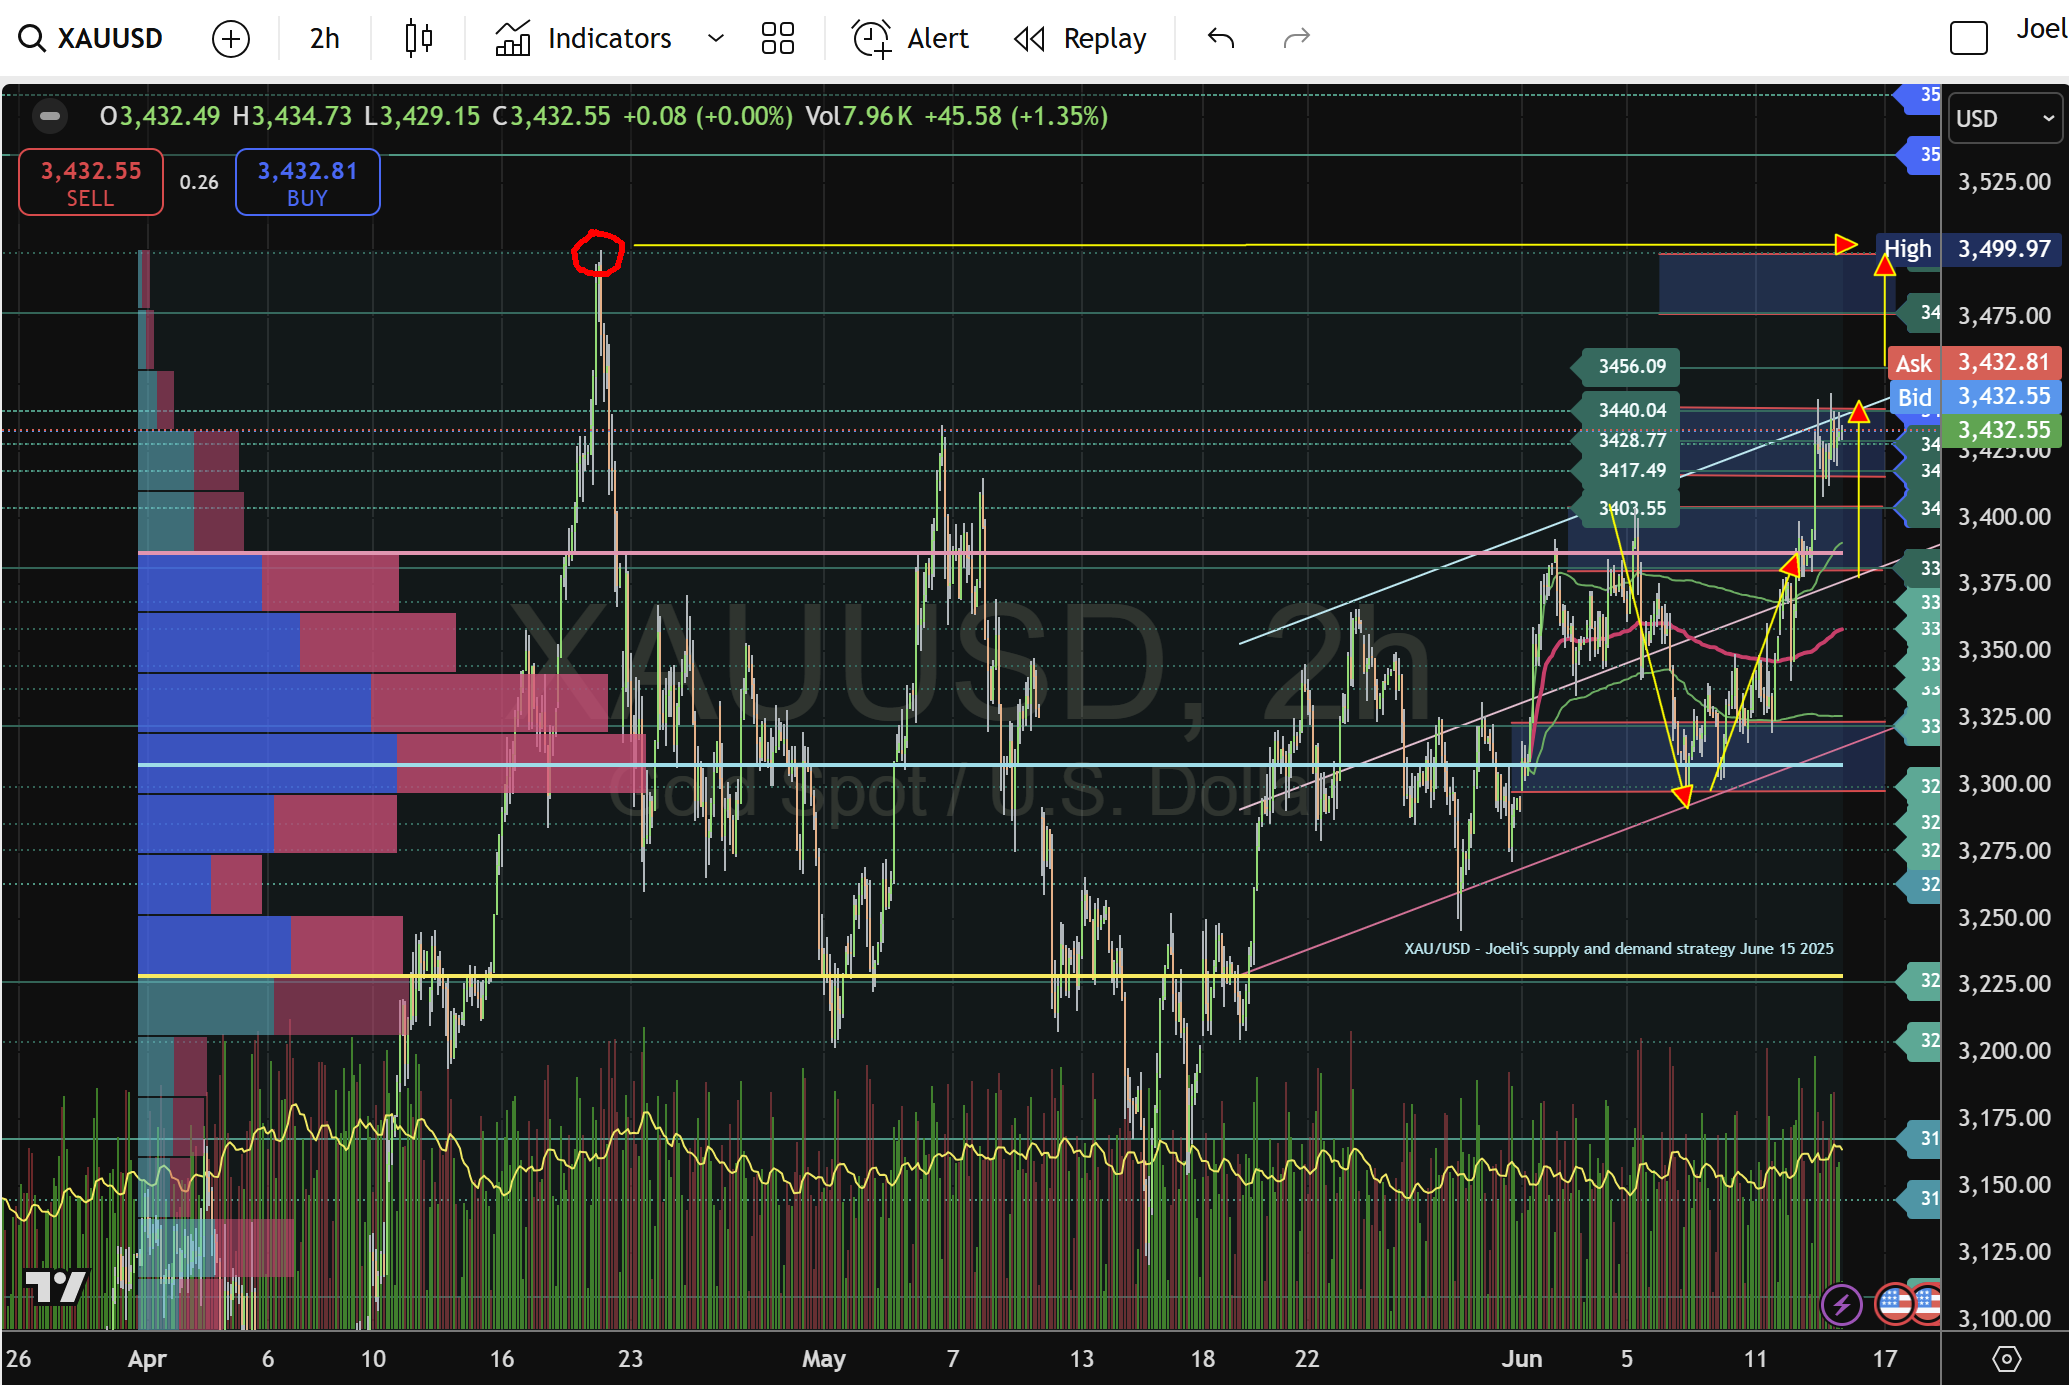
- Demand rebound (June 9): Price bounced off the $3,298-$3,300 demand zone, coinciding with the three-month POC, confirming buyer conviction at that level.
- Channel dynamics: Since early May, gold has traded within an upward-sloping channel bounded by lows near $3,285 and highs around $3,403. The channel floor currently sits near $3,385.
- Supply break (June 13-14): After consolidating beneath the $3,381-$3,403 supply band, an uptick in volume propelled gold above $3,403, triggering stops and fueling momentum into $3,417-$3,440.
Key levels and targets
- Support: $3,417-$3,419 (former supply, now support); Channel floor at ~$3,385; $3,381 (three-month POC line).
- Resistance / Upside objectives: $3,456 (April supply rejection zone); $3,476 (upper channel boundary and prior swing high); $3,500 (psychological cap and April high cluster); Extension toward $3,535-$3,540 if momentum persists.
Fundamental drivers
- Geopolitical risk-off: Israel’s strike on Iran and reciprocal missile fire have amplified safe-haven demand.
- Equity weakness: Breakdowns in SPY and Nasdaq futures boost gold’s appeal as a portfolio diversifier.
- Real yield environment: U.S. real yields remain low; any dovish Fed communication will likely extend the rally.
Outlook
Gold’s bullish bias stays intact while price holds above $3,381. A retest of the channel floor or $3,403-$3,417 area can offer fresh long entries targeting $3,456 and beyond. A close below $3,381 would risk a deeper pullback toward $3,350-$3,360.
Crude Oil (WTI Jul’25): From double-bottom to $85
Technical context and recent moves
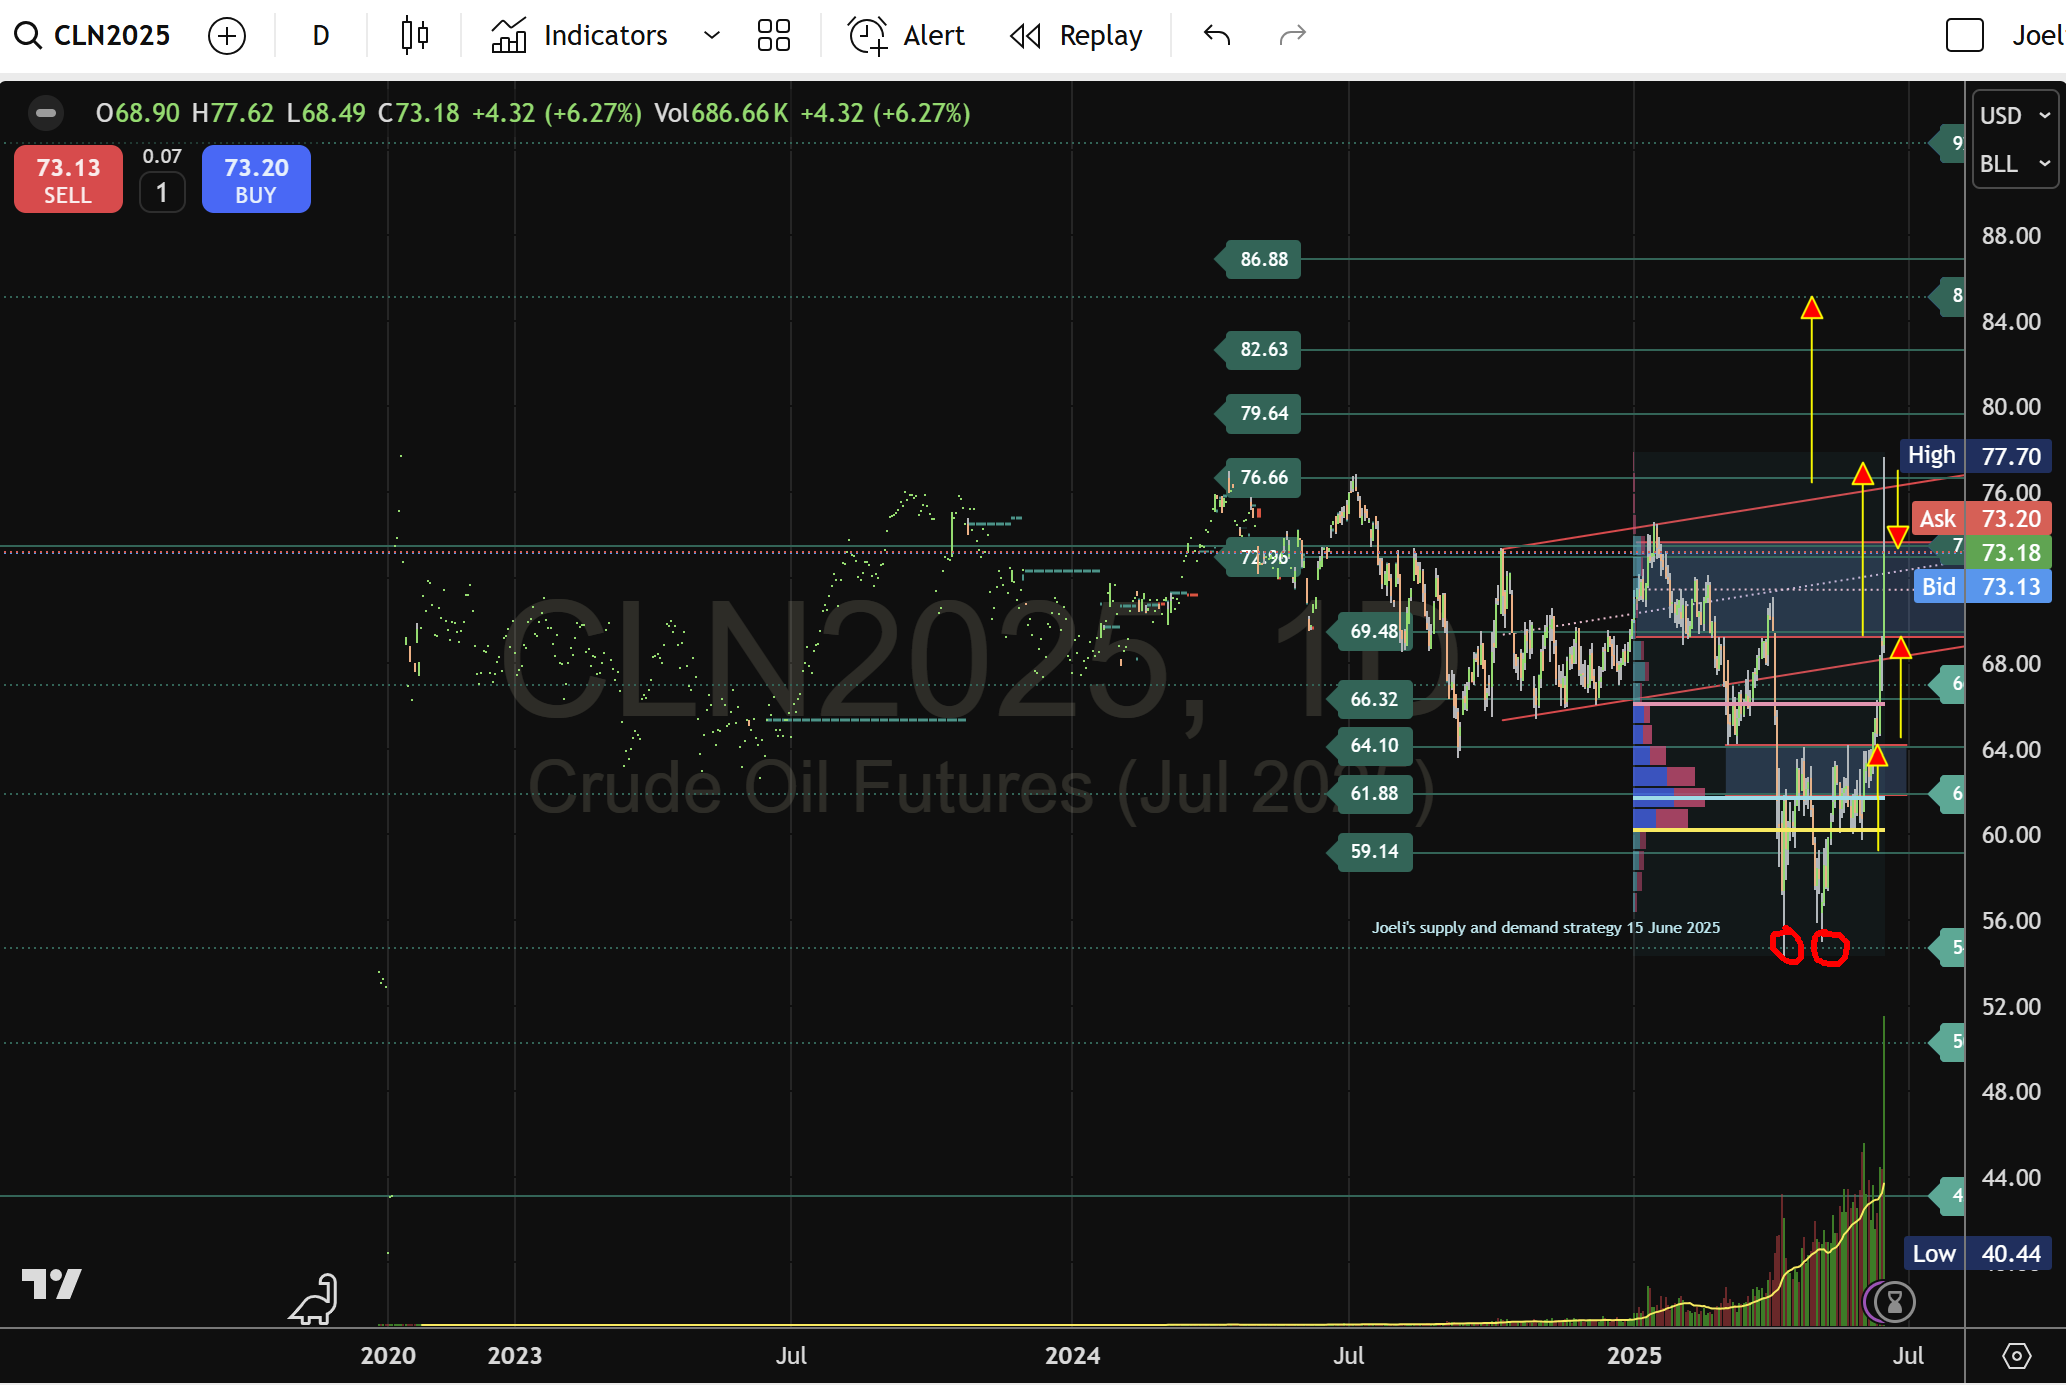
- Double-bottom base (April-May): WTI formed a clear double bottom at $54.70, confirming demand into late May.
- Volume profile build-up: Heavy volume around $61.88-$64.10 (VAL to POC) signalled institutional accumulation ahead of June’s breakout.
- VAH challenge and break (June 11): Price tested the VAH at $67.00 but stalled, then accelerated through the $64.10 supply zone on strong volume.
- Spike to $77.62 (June 13): Supported by a fresh surge of buying, Crude ripped higher, breaching $69.48 resistance and temporarily tagging $77.62 before retreating to close at $73.00.
Key levels and targets
- Support: $73.50-$69.50 (three-month POC and former supply); $67.00 (June swing low); $64.10 (May POC).
- Resistance / Upside objectives: $76.66 (upper trendline of May-June channel); $80.00 round level; $82.00 (late-March supply rejection); $85.00-$86.00 (April supply cluster).
- Downside risk: A drop below $69.50 risks a test of $67.00 (VAH turned support) and $64.10.
Fundamental drivers
- Supply-shock fears: Heightened by Israel-Iran tensions threatening Middle East flows.
- OPEC+ restraint and demand: Continued production discipline and U.S./China summer demand.
- Inventory data: Recent EIA draws have been steeper than expected, underpinning the rally.
Outlook
As long as $73.50-$69.50 holds, bulls can target $76.66 and above. A weekly close under $69.50 would likely invite deeper retracements toward $67.00 and $64.10.
Equities
SPDR S&P 500 ETF (SPY): Rising wedge cracks—downside toward 568.98
Technical context and recent moves
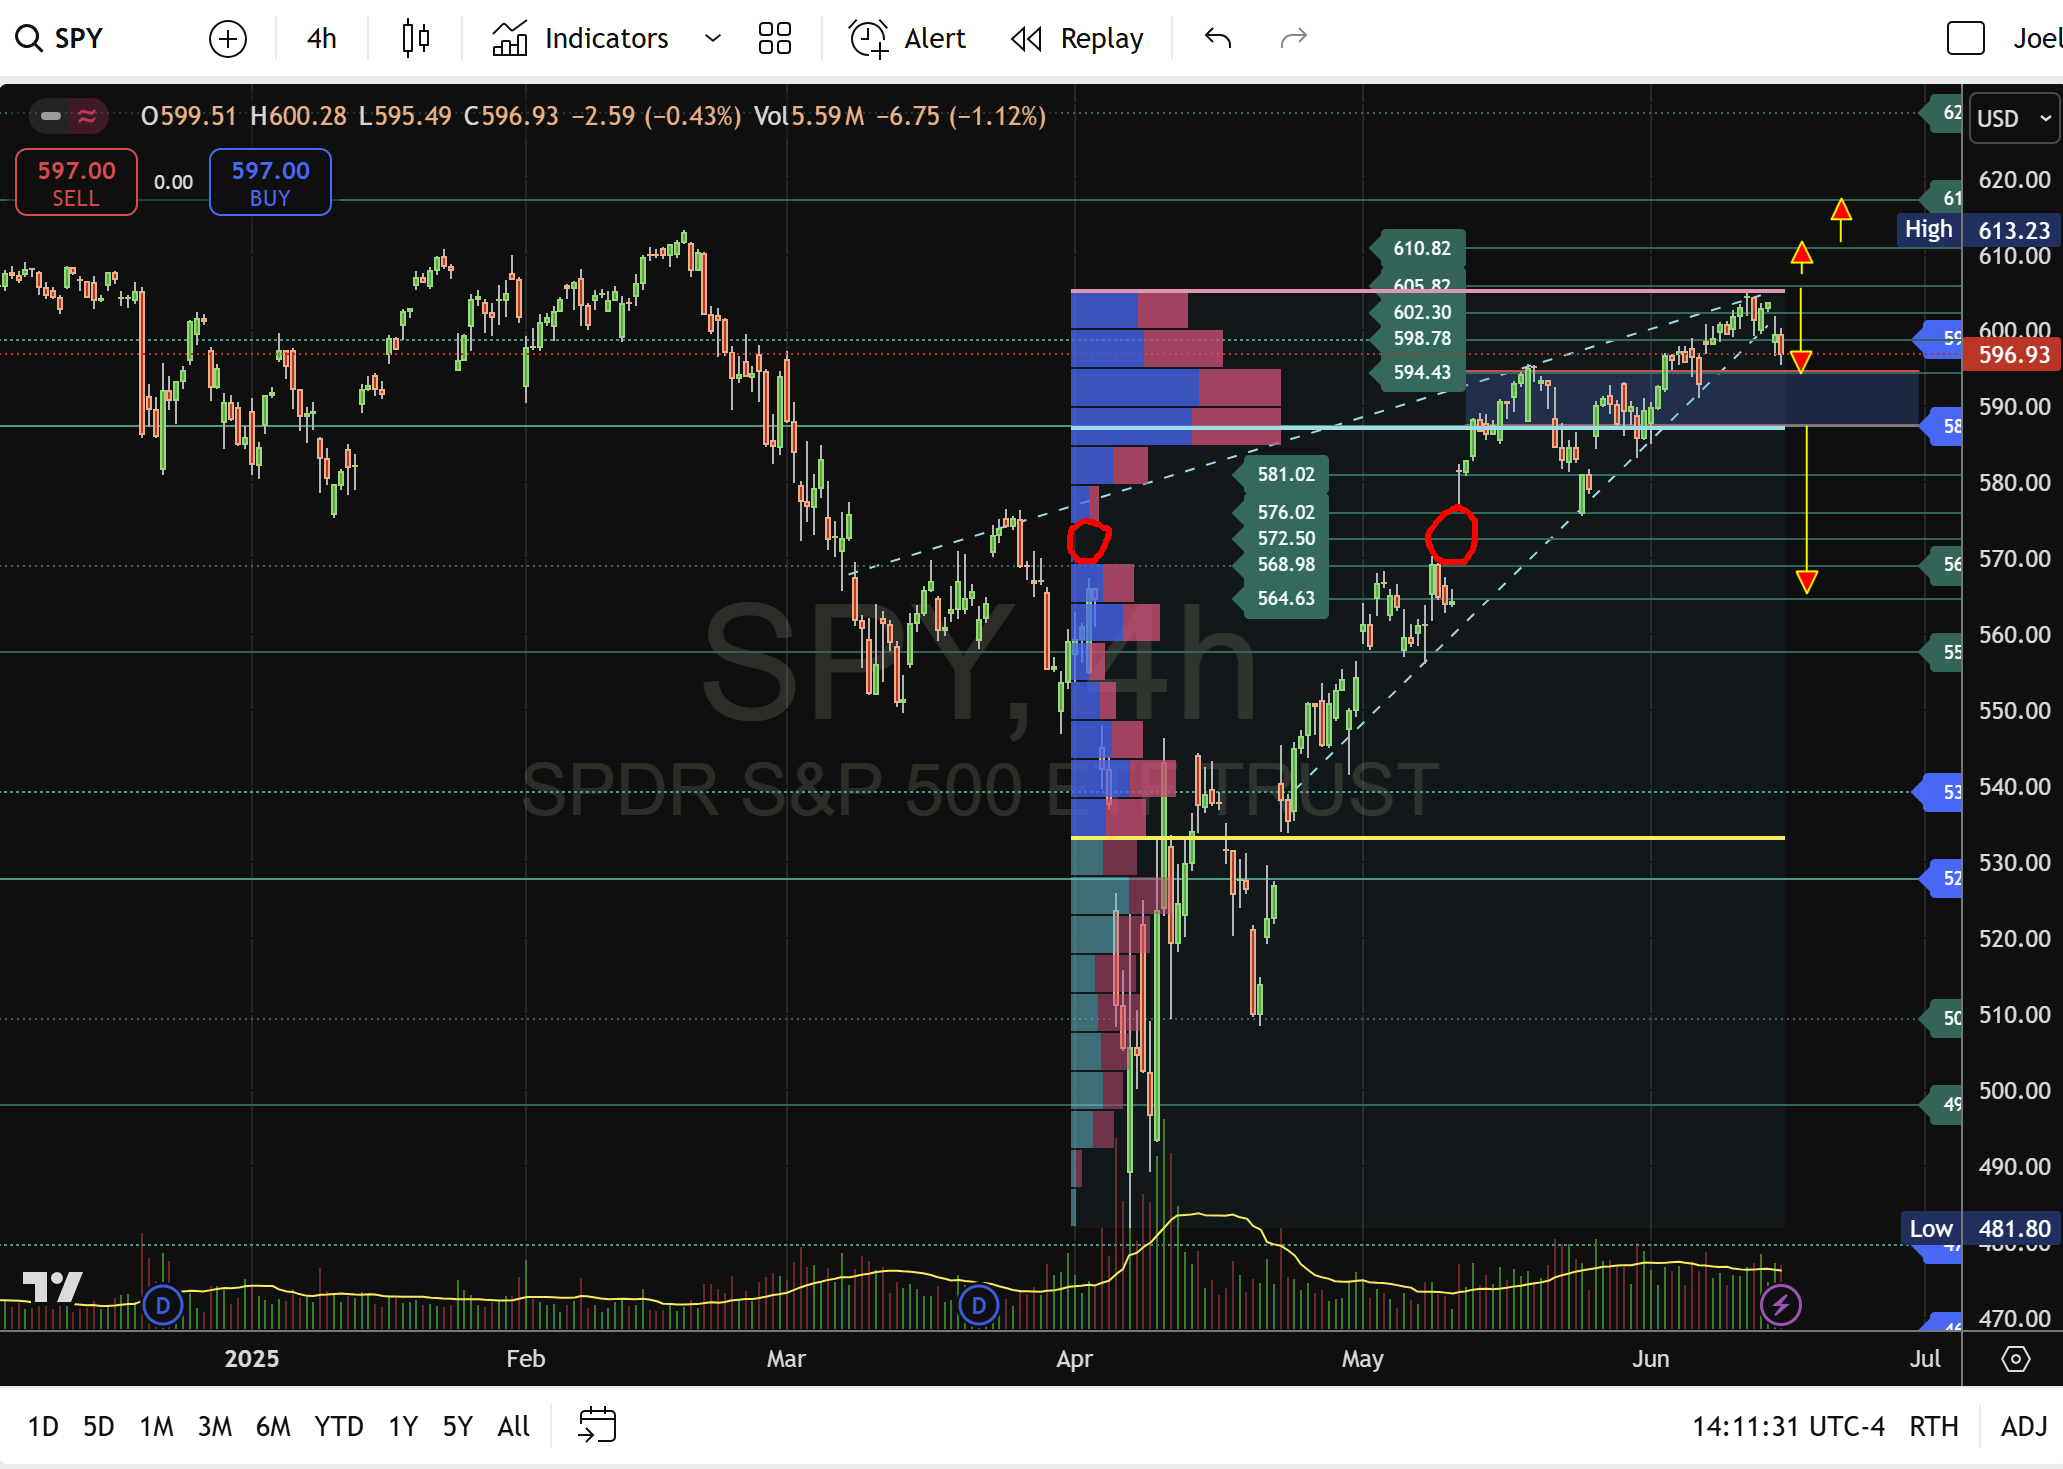
- Wedge build-up: From early April to mid-June, SPY traded within a rising wedge between trendlines, connecting swing lows near $527.80 and highs around $602.30.
- Catalyst and breakdown (June 13-14): The Israel-Iran conflict triggered selling, with Friday’s session closing at $596.93, below the 598.78 support target and slicing through the wedge floor.
Key levels and targets
- Resistance (now pivots): 598.78 (wedge floor), then 602.30 (wedge apex).
- Support: $594.43 (initial POC low); $587.40 (three-month POC zone).
- Secondary targets: $581.00 (former supply turned demand); $576.02-$572.50 (layered volume nodes); $568.98 (May price-gap fill and long-term POC).
- Bearish invalidation: A sustained break back above 605.82 would reopen the bullish wedge scenario.
Fundamental drivers
- Risk-off flows: Fleeing equities into safe havens on Middle East tensions.
- U.S. data and Fed minutes: Mixed PMIs and sticky inflation keep rate-cut bets in check.
- Seasonal liquidity drought: Lower volumes can exacerbate technical moves.
Outlook
With SPY trading under 598.78, look for support at 594.43; a break of 587.40 opens the door to 568.98. A rebound attempt must clear 598.78-602.30 to shift momentum.
E-mini Nasdaq-100 futures (NQU25): Tech’s wedge also bursts
Technical context and recent moves
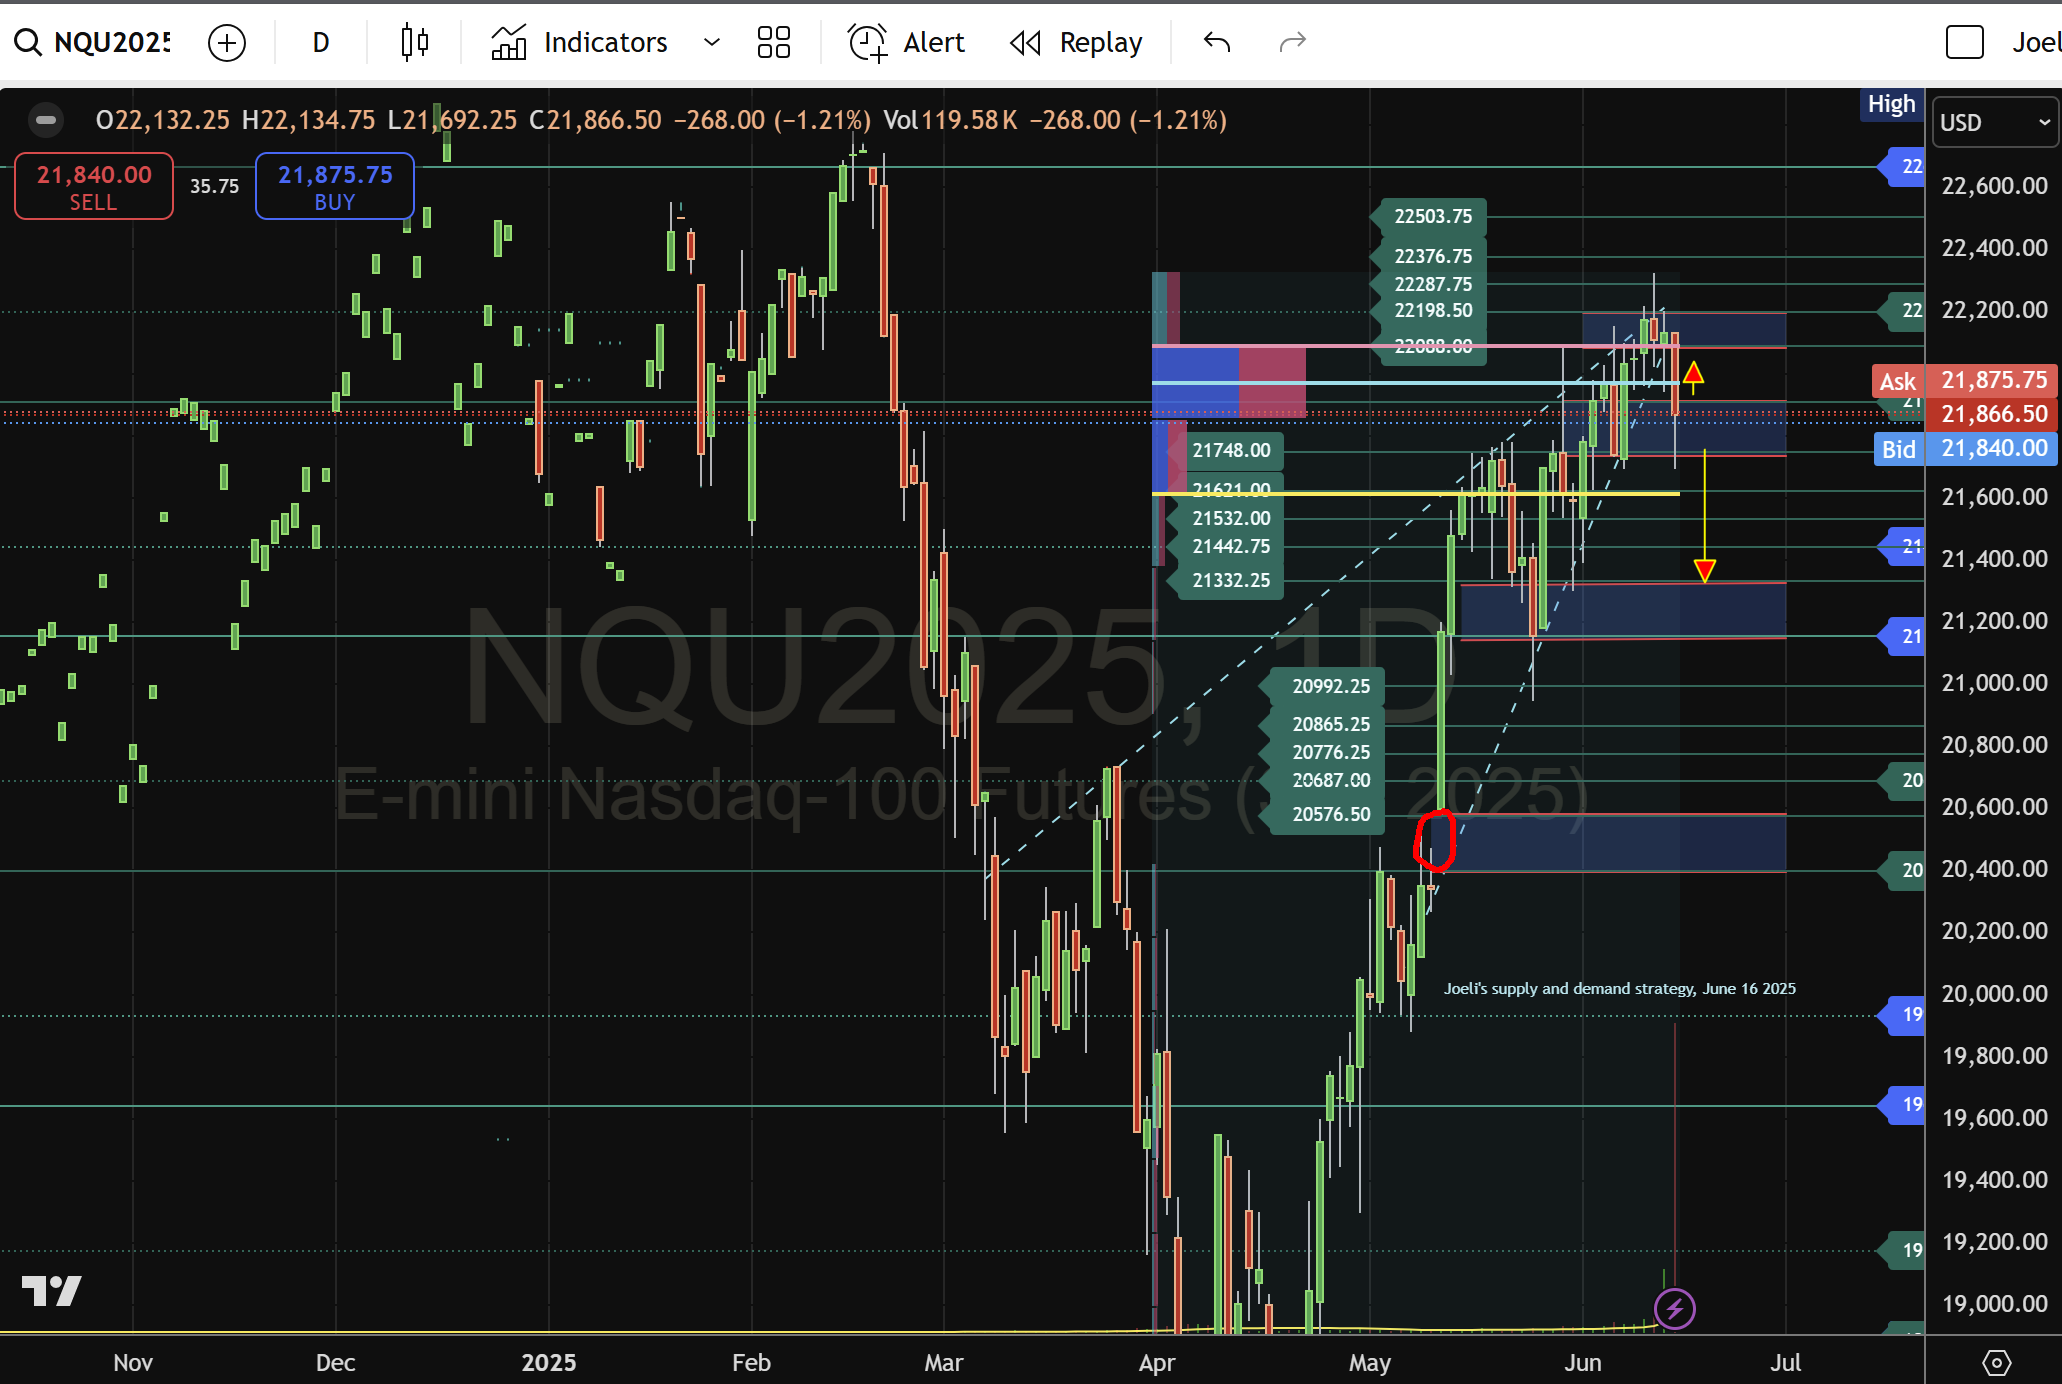
- Wedge build-up: Since March, NQU25 climbed within a rising wedge capped near 22,200 and supported by lows around 20,576.
- Wedge breakdown (June 13): The contract fell decisively below 22,000, breaching both the VAH at 22,088 and the POC at 21,909.
Key levels and targets
- Resistance (now pivots): 22,000 round level, VAH at 22,088, wedge upper trendline near 22,200.
- Immediate supports: $21,909 (minor swing low and POC level); $21,748 (primary demand-zone base).
- Secondary targets: $21,621, $21,532, $21,442, $21,332 (layered volume nodes).
- Deeper pullback risk: Break below $21,154 could target the May gap zone at $20,576 via 20,992, 20,865, 20,776 and 20,687.
- Bullish reclaim: A move back above $21,909 would set sights on 22,088 and the April high near 22,287.
Fundamental drivers
- Geopolitical risk-off: Amplifying pressure on high-beta and AI-sensitive tech stocks.
- Earnings and growth concerns: Profit-taking ahead of major tech earnings and tempered AI enthusiasm.
- Fed policy uncertainty: Delayed rate-cut expectations pressuring equity valuations.
Outlook
Bulls must defend $21,748 to prevent a slide through successive demand bands. A rally above $21,909 is required to re-establish bullish conviction and challenge 22,000-22,088.
All price levels and targets derive from the current price structure and volume profile analysis. This analysis is for informational purposes and not financial advice.