
Valuation Assessment of Core Natural Resources Inc CNR
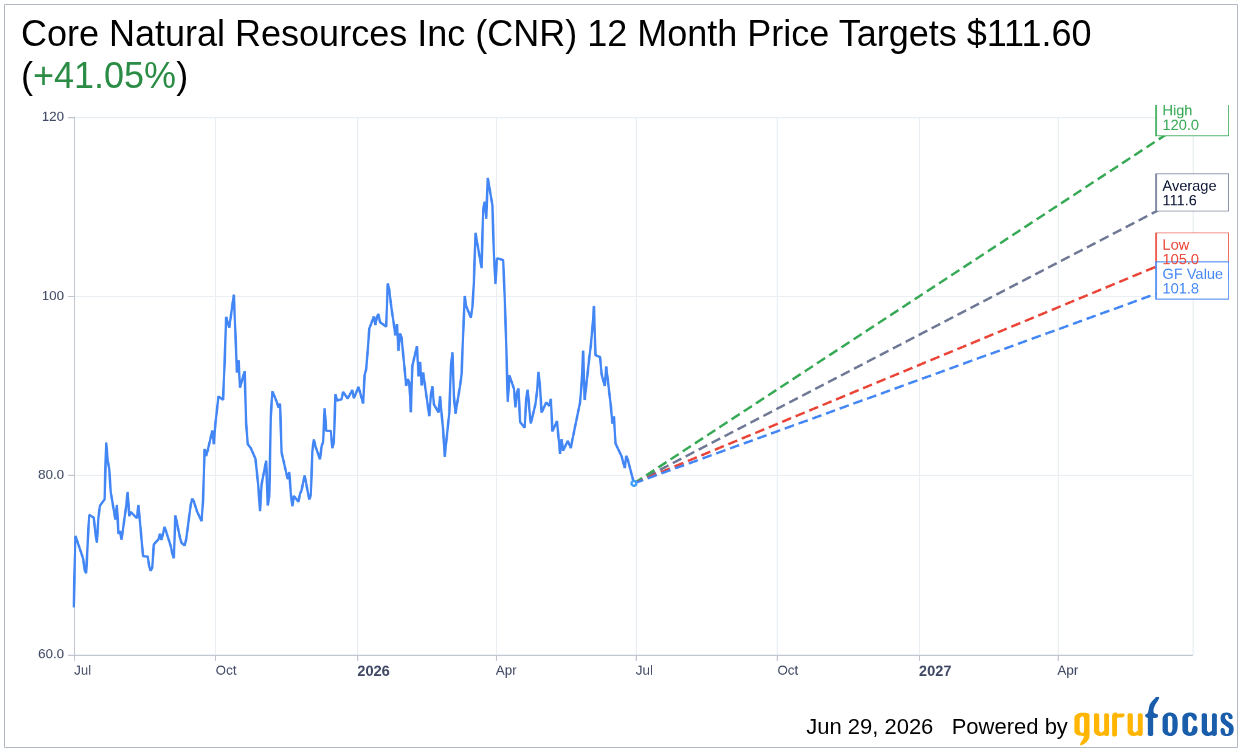
On June 29, 2026, Core Natural Resources Inc (CNR) shares fell 3.2% today, bringing the current price to $79.12. This decline is part of a broader trend, with shares down 10.5% over the last month and 10.4% year-to-date. CNR has experienced a volatile price range over the past year, peaking at $114.80 and touching a low of $64.57.
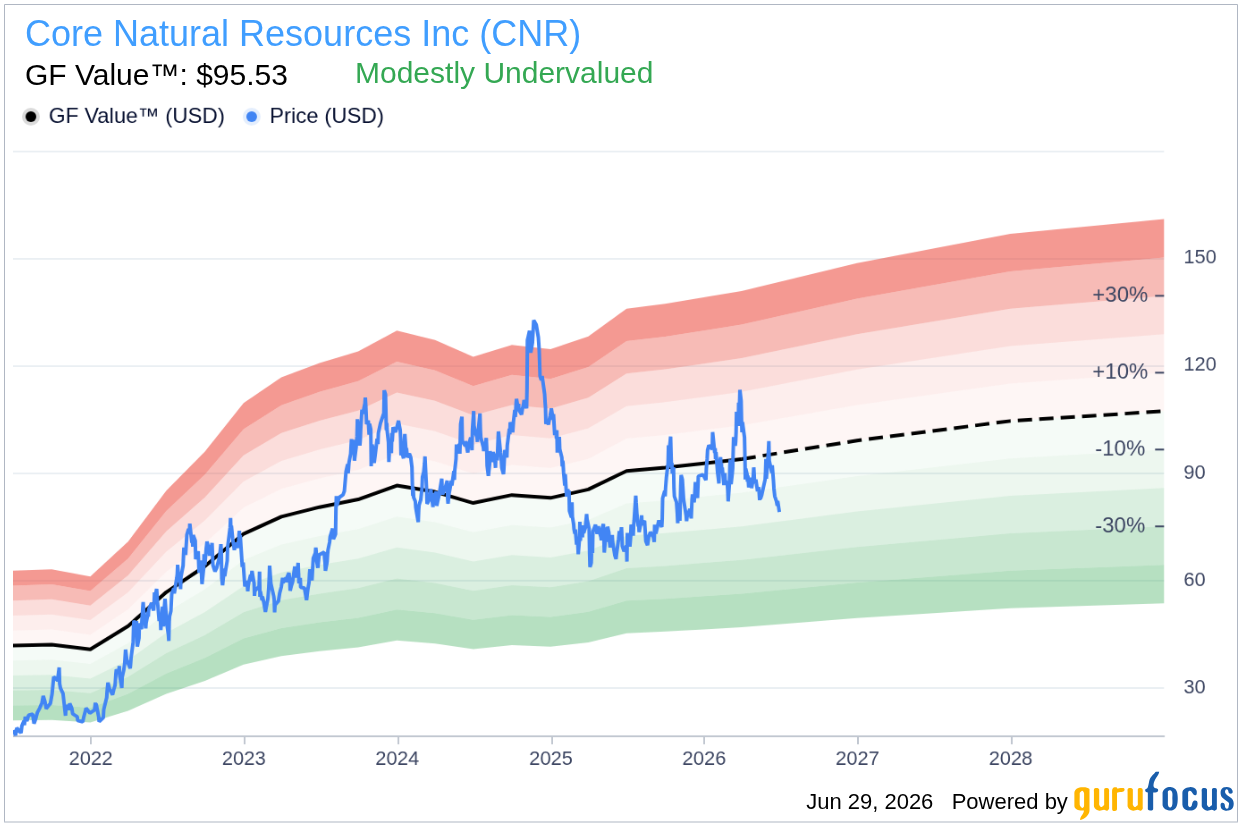
- GF Value™ verdict: Current price of $79.12 is 17.2% below GF Value™ of $95.53.
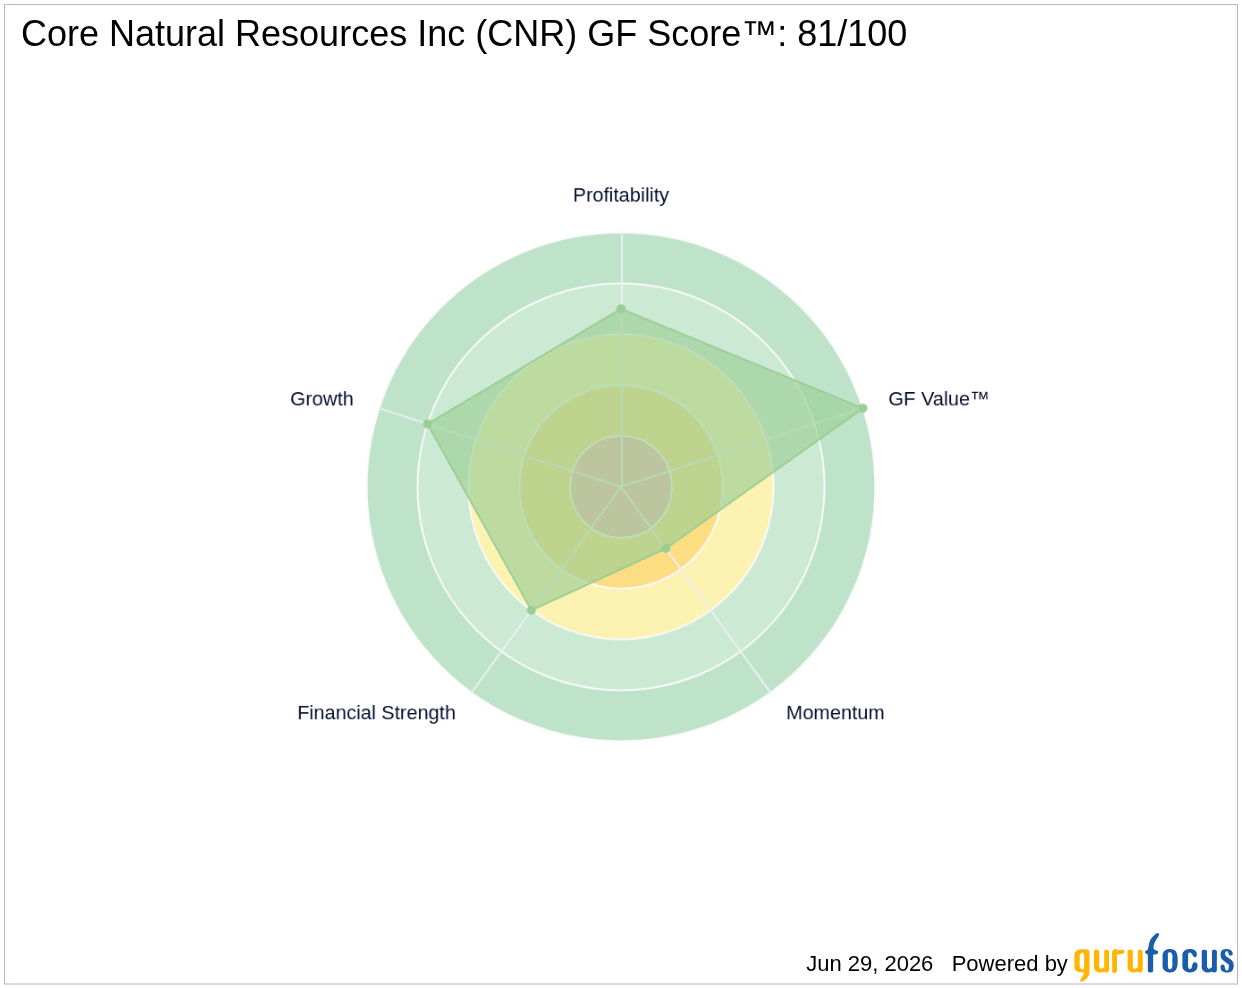
- GF Score™ of 81/100 indicates a strong overall ranking based on key financial metrics.
- Notable signal: No insider transactions have occurred in the last three months.
Is CNR Overvalued or Undervalued?
The current price of Core Natural Resources Inc CNR shares at $79.12 is significantly below the GF Value™ estimate of $95.53, indicating that the stock is undervalued by approximately 17.2%. This margin of safety suggests there may be an investment opportunity for those looking to capitalize on potential future price appreciation. The GF Valuation label categorizes the stock as Modestly Undervalued, which aligns with the current price’s position relative to the estimated intrinsic value.
While the undervaluation presents an opportunity, investors should remain cautious. The volatility observed in CNR’s stock price, evidenced by a 10.5% drop over the last month, underscores the risks involved. Additionally, the predictability rating of 1 star indicates uncertainty in future performance, suggesting that while the stock may appear attractive based on GF Value™, potential investors should weigh the associated risks before making decisions.
How Does CNR’s Valuation Compare to Its History?
| Metric | Current | Historical |
|---|---|---|
| P/E (TTM) | 24.9x | 7.1x (5-Year Median) |
Core Natural Resources Inc is currently trading at a forward P/E ratio of 24.9x, which is significantly above its 5-year median P/E of 7.1x. This analysis suggests that the stock is trading well above its historical valuation, which raises questions about the sustainability of its current price level. This P/E analysis indicates a disagreement with the GF Value™ verdict, which suggests undervaluation. The elevated P/E ratio could imply that the market has high expectations for future earnings growth that may not be realized.
What Does CNR’s GF Score™ Tell Us?
| Metric | Rating |
|---|---|
| GF Score™ | 81/100 |
| Financial Strength | 6/10 |
| Profitability | 7/10 |
| Growth | 8/10 |
| Valuation | 10/10 |
| Momentum | 3/10 |
The GF Score™ of 81/100 reflects a strong overall performance across various financial metrics. The strongest area is Valuation, which scored a perfect 10/10, indicating that the current price is perceived as low relative to intrinsic value. In contrast, the Momentum score of 3/10 signals weak performance in terms of price trends, suggesting that recent price movements have not been favorable. Financial Strength, Profitability, and Growth scored 6/10, 7/10, and 8/10 respectively, indicating a moderately strong financial position with good growth prospects but some weaknesses that should be monitored.
What Are Insiders Doing with CNR Stock?
Over the past three months, there have been no insider transactions reported for Core Natural Resources Inc. This lack of insider activity may suggest that current stakeholders are not making significant changes to their positions, which could indicate a neutral outlook among insiders regarding the company’s future performance. Typically, active insider buying can be a bullish signal, while selling may indicate a lack of confidence. In this case, the absence of both could be taken as a sign of stability, but it also reflects a lack of urgency from insiders to act on their holdings.
What This Means for Investors
Based on the GF Value™ estimate of $95.53 compared to the current trading price of $79.12, Core Natural Resources Inc is considered undervalued. However, the high forward P/E ratio and recent price declines warrant caution. Investors may find potential in CNR, but they should carefully consider the associated risks and recent performance trends before making investment decisions.
For the complete analysis, visit the Core Natural Resources Inc CNR stock page. You can also explore the GF Value™ page for detailed valuation methodology, or use the GuruFocus Stock Screener to find similar opportunities.
Frequently Asked Questions
What is CNR’s GF Score™?
CNR’s GF Score™ is 81/100, indicating a strong overall ranking based on key financial metrics and potential for long-term returns.
Is CNR overvalued or undervalued?
CNR is currently undervalued, with a GF Value™ of $95.53 compared to its current price of $79.12, representing a 17.2% discount.
What is CNR’s P/E ratio?
CNR’s forward P/E ratio is 24.9x, which is significantly above its 5-year median P/E of 7.1x, indicating that the stock is trading at a higher valuation than its historical average.
This stock alert was generated using automated technology and GuruFocus financial data to provide readers with timely and accurate market reporting. This content was reviewed by GuruFocus editorial team prior to publication. Please send any questions or comments about this story to [email protected].


Leave a comment