- Gold price bounces back toward $3,400 early Wednesday, awaits US jobs data.
- The US Dollar loses JOLTS survey-led traction as trade jitters remain a drag.
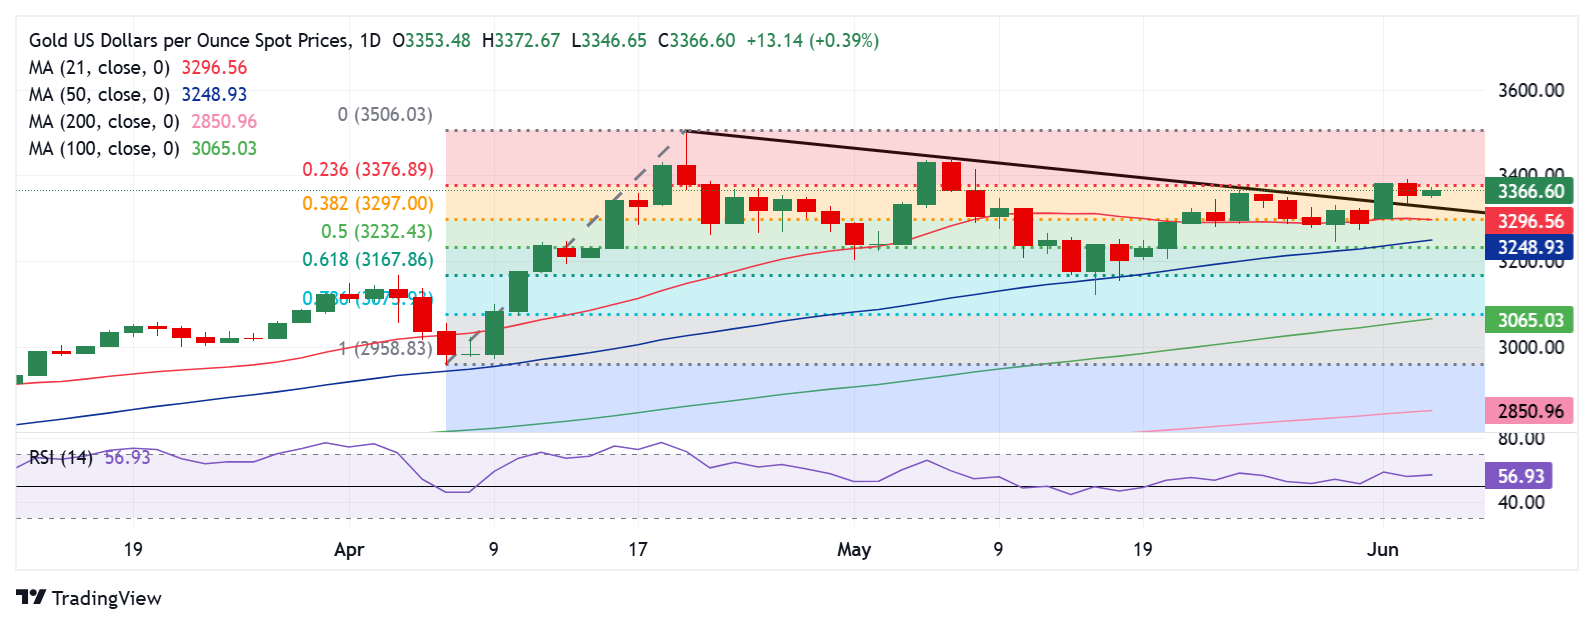
- Gold price retests key resistance zone near $3,377 on the daily chart amid bullish RSI.
Gold price is staging a tepid turnaround above $3,350 in Asian trading on Wednesday. Gold buyers keenly await the high-impact US data releases and speeches from Federal Reserve (Fed) policymakers for a sustained move higher.
Gold price looks to US data for further gains
Having retreated from the monthly high of $3,392 on Tuesday, Gold price is recovering some ground amid a renewed selling wave around the US Dollar (USD) as trade concerns return to the fore.
The Trump administration’s deadline for its trading partners to submit their best offers on trade looms this Wednesday while a doubling of levies to 50% on imported steel and aluminium will take effect at 4 GMT.
Additionally, markets remain wary of the likely talks between US President Donald Trump and his Chinese counterpart Xi Jinping on Friday, especially after US Federal Bureau of Investigation (FBI) Director Kash Patel confirmed via a post on X the arrest of two Chinese nationals charged for smuggling potential bioterror fungus into the US.
Last week, both sides accused each other of violating the terms of an agreement in May to lower some tariffs.
The USD-denominated bright metal could receive a brief boost as the Greenback sees a fresh leg down on US steel and aluminium tariffs coming into effect.
Attention will then turn toward the top-tier US ADP Employment Change and ISM Services PMI data due later in the American session for fresh signs on the health of the US economy. This could provide hints on the Fed’s next policy move and direction on the USD.
On Tuesday, the US Dollar found some respite from stronger-than-expected JOLTS Job Openings, which are closely watched by the Fed.
The number of job openings on the last business day of April stood at 7.39 million, following 7.2 million openings recorded in March. The market expectation was for 7.1 million.
Gold price technical analysis: Daily chart

The short-term technical outlook remains constructive so long as the confluence of the 21-day Simple Moving Average (SMA) and the 38.2% Fibonacci Retracement (Fibo) level of the April record rally at $3,297 is held.
The 14-day Relative Strength Index (RSI) is pointing north while comfortably above the midline, justifying the renewed upside.
Gold buyers must scale the 23.6% Fibo resistance at $3,377 on a daily candlestick closing basis to resume the recent upswing toward the lifetime highs of $3,500.
Ahead of that, the May high of $3,439 must be taken out.
Gold price stormed through the falling trendline resistance, then at $3,346, to finish Monday at $3,382.
Alternatively, sellers could attempt control on a break below the falling trendline resistance-turned-support, now at $3,325.
The next support is seen at the abovementioned powerful confluence of $3,297.
The last line of defense for buyers is aligned near $3,240, where the 50% Fibo level and the 50-day SMA hang around.
Economic Indicator
ADP Employment Change
The ADP Employment Change is a gauge of employment in the private sector released by the largest payroll processor in the US, Automatic Data Processing Inc. It measures the change in the number of people privately employed in the US. Generally speaking, a rise in the indicator has positive implications for consumer spending and is stimulative of economic growth. So a high reading is traditionally seen as bullish for the US Dollar (USD), while a low reading is seen as bearish.
Next release:
Wed Jun 04, 2025 12:15
Frequency:
Monthly
Consensus:
115K
Previous:
62K
Source:
ADP Research Institute


