

Amid renewed tensions in the Middle East, most Gulf markets have experienced declines, reflecting investor caution as geopolitical uncertainties weigh on sentiment. Despite this challenging environment, dividend stocks with yields over 3% can offer a potential source of steady income for investors seeking stability and resilience in turbulent times.
Top 10 Dividend Stocks In The Middle East
| Name | Dividend Yield | Dividend Rating |
| Yeni Gimat Gayrimenkul Yatirim Ortakligi (IBSE:YGGYO) | 3.23% | ★★★★★☆ |
| Turkiye Garanti Bankasi (IBSE:GARAN) | 3.39% | ★★★★★☆ |
| Saudi Investment Bank (SASE:1030) | 6.07% | ★★★★★☆ |
| National General Insurance (P.J.S.C.) (DFM:NGI) | 8.46% | ★★★★★☆ |
| Emirates Insurance Company P.J.S.C (ADX:EIC) | 8.31% | ★★★★★★ |
| Emaar Properties PJSC (DFM:EMAAR) | 8.90% | ★★★★★☆ |
| Dubai Insurance Company (P.S.C.) (DFM:DIN) | 5.88% | ★★★★★☆ |
| Arab National Bank (SASE:1080) | 6.20% | ★★★★★☆ |
| Anadolu Hayat Emeklilik Anonim Sirketi (IBSE:ANHYT) | 7.98% | ★★★★★☆ |
| Akbank T.A.S (IBSE:AKBNK) | 3.29% | ★★★★★☆ |
Click here to see the full list of 63 stocks from our Top Middle Eastern Dividend Stocks screener.
Let’s dive into some prime choices out of the screener.
Simply Wall St Dividend Rating: ★★★★☆☆
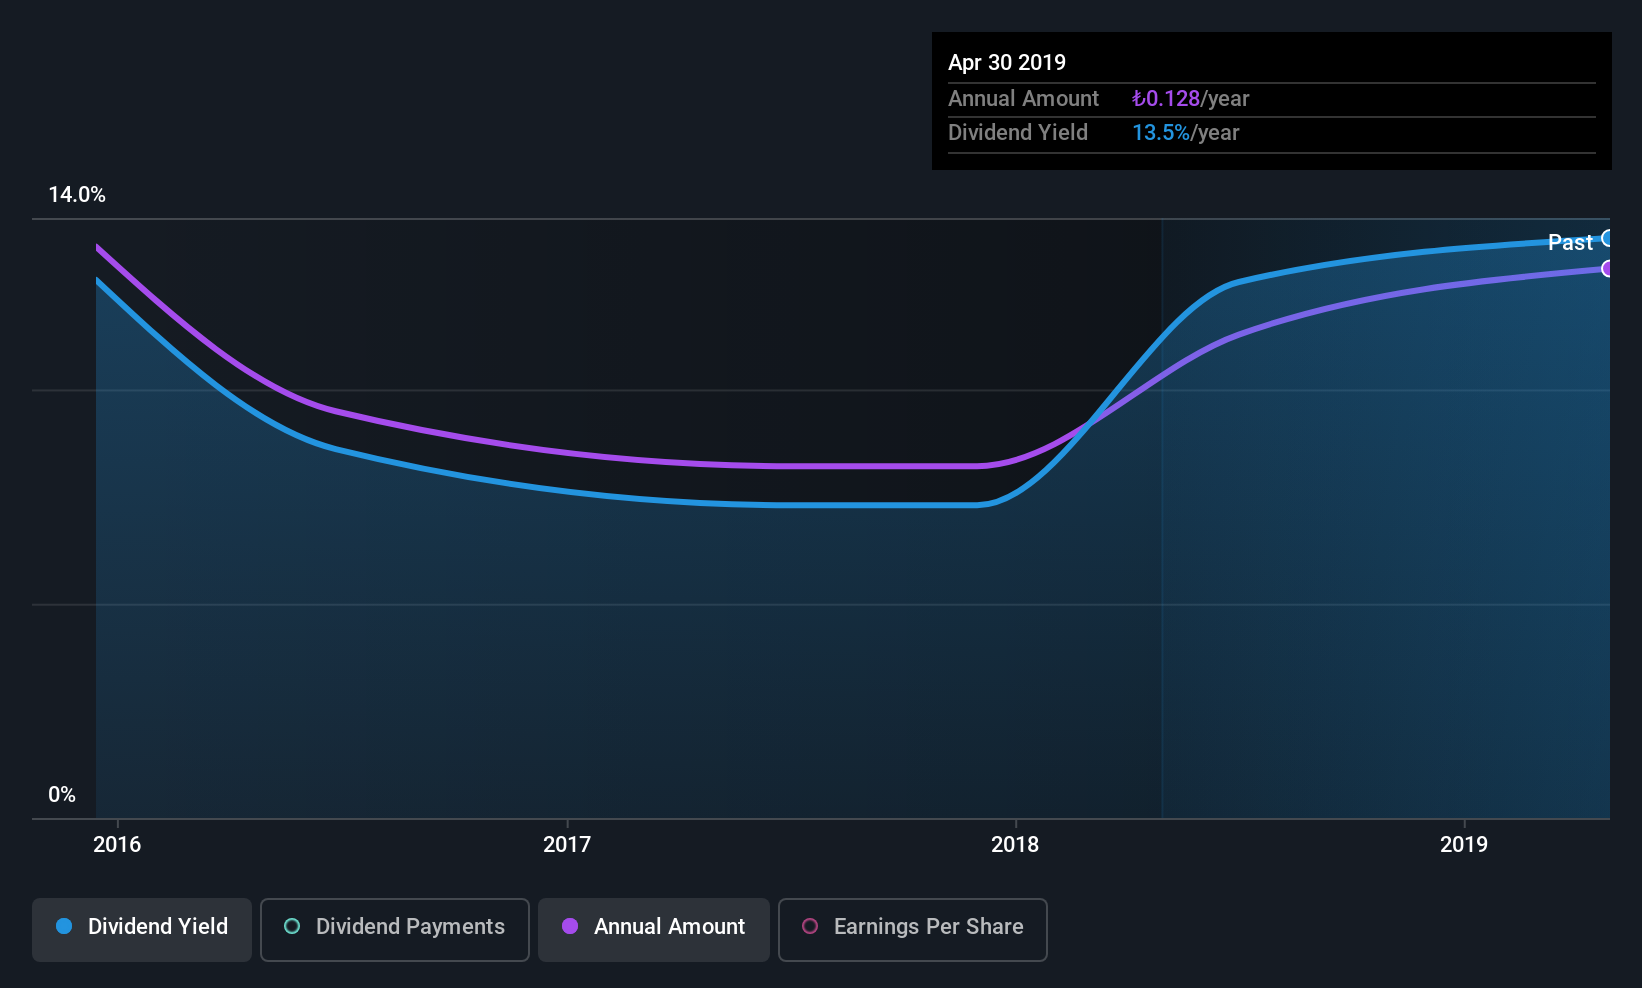
Overview: OYAK Çimento Fabrikalari A.S. operates in Turkey, producing and selling clinker and cement through its subsidiaries, with a market capitalization of TRY100.83 billion.
Operations: OYAK Çimento Fabrikalari A.S. generates revenue primarily from its Cement segment, which accounts for TRY34.25 billion, and its Ready-Mixed Concrete segment, contributing TRY19.41 billion.
Dividend Yield: 4.8%
OYAK Çimento Fabrikalari’s dividend yield of 4.82% ranks in the top 25% of Turkish market payers but is not well covered by cash flows, with a high cash payout ratio of 165%. Despite trading at good value and below fair value estimates, its dividends have been volatile over the past decade. Recent earnings showed a significant drop in net income to TRY 102.52 million from TRY 1.30 billion year-on-year, raising concerns about future dividend sustainability.
Simply Wall St Dividend Rating: ★★★★☆☆
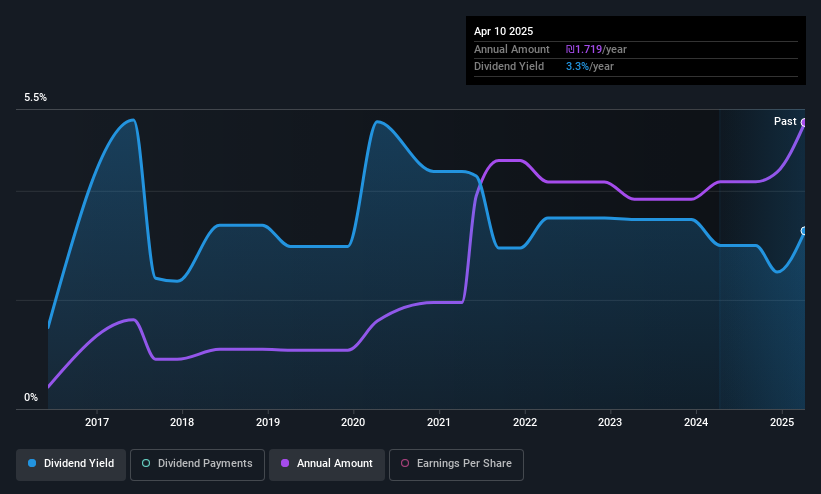
Overview: Bank Hapoalim B.M., with a market cap of ₪91.45 billion, offers a range of banking and financial services in Israel, North America, Europe, and internationally through its subsidiaries.
Operations: Bank Hapoalim B.M.’s revenue segments include Israel – Households – Other at ₪5.45 billion, Overseas – Business Activity at ₪910 million, Households – Housing Loans Israel at ₪1.72 billion, and Israel – Households – Credit Cards at ₪454 million.
Dividend Yield: 4.4%
Bank Hapoalim B.M.’s dividend payments have been volatile over the past decade, though they have grown during this period. The current payout ratio of 44.4% indicates dividends are well covered by earnings and are expected to remain so in three years with a forecasted 40.4% payout ratio. Despite trading slightly below fair value, its dividend yield of 4.45% is lower than the top tier in Israel’s market, and recent earnings guidance suggests stable profitability growth ahead.

Simply Wall St Dividend Rating: ★★★★☆☆
Overview: Tigbur Group Ltd offers personnel and nursing services in Israel with a market cap of ₪591.38 million.
Operations: Tigbur Group Ltd generates revenue through its personnel and nursing services in Israel.
Dividend Yield: 3%
Tigbur Group’s dividends are well covered by earnings and cash flows, with payout ratios of 51.6% and 37.2%, respectively. However, the dividend payments have been volatile over the past decade despite some growth. The current yield of 3.04% is below the top tier in Israel’s market. Recent earnings show stable sales but a slight decline in net income year-over-year, potentially impacting future dividend reliability amidst an unstable track record.
Summing It All Up
Curious About Other Options?
This article by Simply Wall St is general in nature. We provide commentary based on historical data
and analyst forecasts only using an unbiased methodology and our articles are not intended to be financial advice. It does not constitute a recommendation to buy or sell any stock, and does not take account of your objectives, or your
financial situation. We aim to bring you long-term focused analysis driven by fundamental data.
Note that our analysis may not factor in the latest price-sensitive company announcements or qualitative material.
Simply Wall St has no position in any stocks mentioned.
New: AI Stock Screener & Alerts
Our new AI Stock Screener scans the market every day to uncover opportunities.
• Dividend Powerhouses (3%+ Yield)
• Undervalued Small Caps with Insider Buying
• High growth Tech and AI Companies
Or build your own from over 50 metrics.
Have feedback on this article? Concerned about the content? Get in touch with us directly. Alternatively, email editorial-team@simplywallst.com


Leave a comment