XAU/USD Current price: $3,311.12
- The US April ISM Services PMI came in much better than expected, at 51.6.
- US Treasury Secretary Bessent said trade deals with different nations could be announced this week.
- XAU/USD recovered the $3,300 mark and could extend gains in the upcoming sessions.
Gold turned higher on Monday, recovering the $3,300 mark and posting an intraday high of $3,328.94 early in the American session amid broad US Dollar (USD) weakness. Despite encouraging comments from United States (US) President Donald Trump regarding progress in trade talks with China, financial markets remained cautiously optimistic throughout the first half of the day.
Demand for the USD remained subdued, yet better-than-anticipated data gave the Greenback a near-term impulse after Wall Street’s opening. The April ISM Services Purchasing Managers’ Index (PMI) beat expectations of 50.4, printing at 51.6 and improving from the 50.8 posted in March.
Meanwhile, comments from US Treasury Secretary Scott Bessent also backed the USD. Bessent said we could see “substantial progress” on trade with China in the upcoming weeks while announcing good trade proposals from other trading partners. He also anticipated that some trade deals could be announced as soon as this week.
Finally, it’s worth adding that the US Federal Reserve (Fed) will announce its decision on monetary policy on Wednesday. The central bank is widely anticipated to keep interest rates on hold, with the focus on Chairman Jerome Powell’s words on the near-term future of monetary policy.
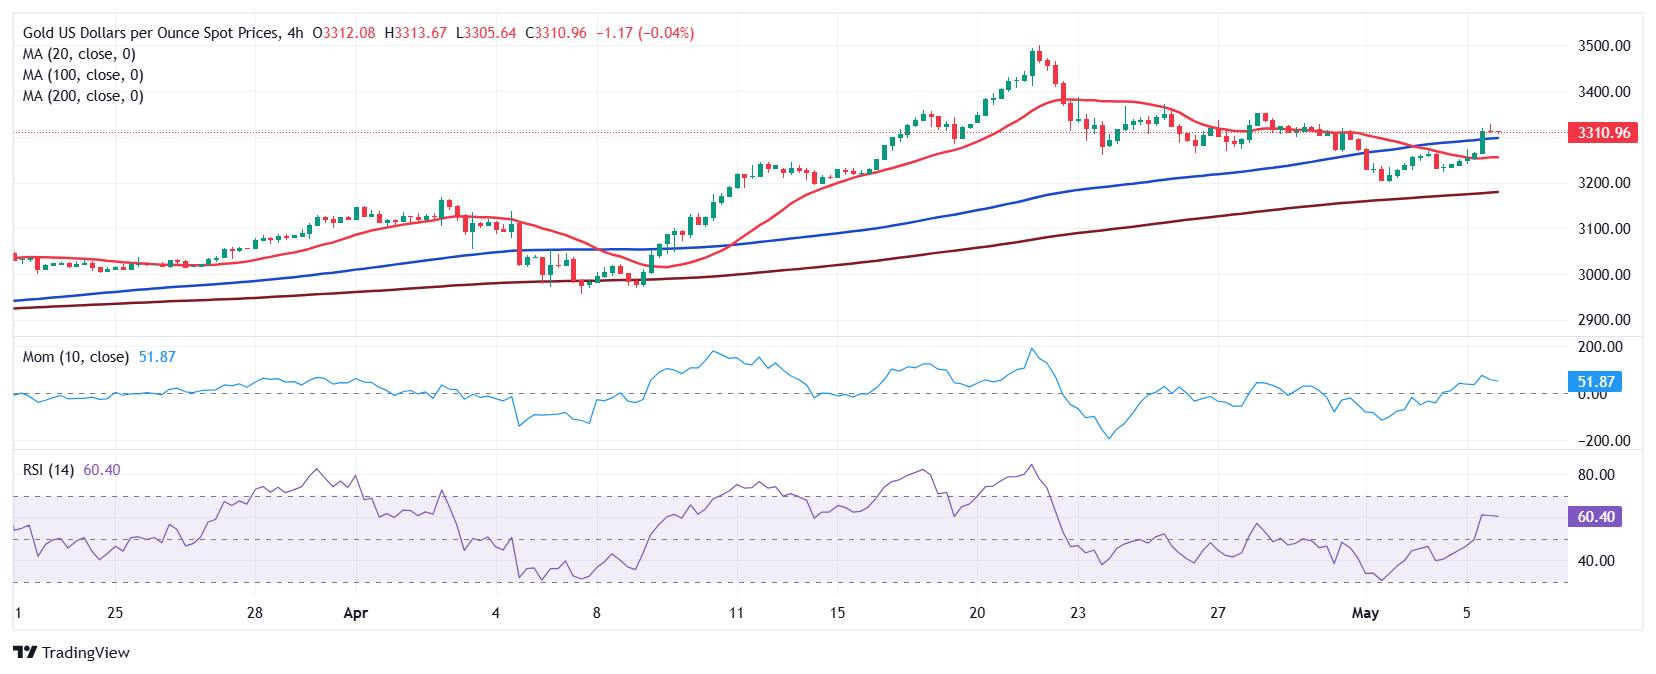
XAU/USD short-term technical outlook
The daily chart for the XAU/USD pair shows that bulls hold the grip. After last week’s slide, the pair managed to bounce from around a bullish 20 Simple Moving Average (SMA), providing support at around $3,253.45. The 100 and 200 SMAs maintain their bullish slopes far below the shorter one, aligning with the upward trend. Finally, technical indicators bounced from around their midlines, currently gaining upward traction within positive levels, in line with higher highs for the week.
The near-term picture shows the risk skews to the upside, although the positive momentum receded. In the 4-hour chart, technical indicators have turned flat near their intraday peaks well above their midlines. At the same time, XAU/USD develops above all its moving averages, with the 20 SMA losing its bearish momentum after crossing below a still bullish 100 SMA.
Support levels: 3,290.10 3,273.15 3,258.60/
Resistance levels: 3,329.90 3,352.80 3,370.55