

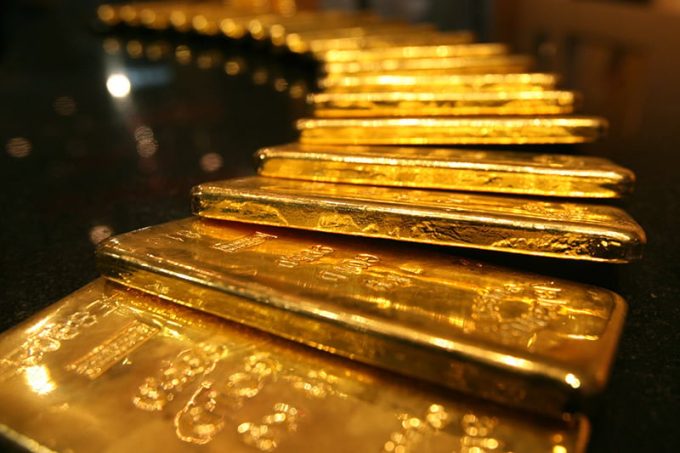
Spot gold hit $4,781 per ounce on April 14, 2026, up $53 from the prior day, fueled by persistent inflation concerns and strong physical buying—key signals for U.S. portfolios seeking hedges against dollar weakness and Fed uncertainty.
Spot gold prices climbed to $4,781 per troy ounce on April 14, 2026, at 9:15 a.m. Eastern Time, marking a $53 gain from the same time the previous day and underscoring gold’s role as a critical hedge for U.S. investors amid rising inflation expectations and macroeconomic uncertainty.
As of: April 14, 2026, 9:15 p.m. ET (converted from Europe/Berlin master clock)
Daily Price Momentum in Spot Gold
The spot gold market, representing immediate over-the-counter trades for physical delivery, saw this uptick as demand strengthened. Unlike COMEX gold futures, which trade on the CME and reflect future delivery expectations, spot gold directly gauges current physical and investor appetite. This $4,781 level reflects a year-over-year increase of $1,551, or over 48%, highlighting gold’s long-term appreciation amid global volatility.
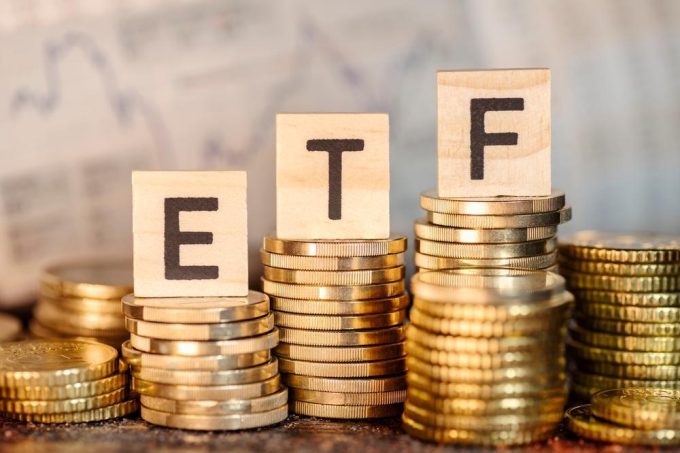
For U.S. investors, this matters because spot gold influences pricing in gold ETFs like SPDR Gold Shares (GLD) and physical bullion dealers. A higher spot price signals tighter supply dynamics or heightened safe-haven buying, often inversely correlated with U.S. Treasury yields and the dollar index.
Physical Premiums Signal Robust Demand
As spot gold approaches $4,800, physical premiums at major U.S. bullion dealers remain elevated, with silver clearing $78 per ounce. These premiums—the markup over spot for coins and bars—indicate strong retail and institutional physical demand, not fully captured in futures markets. In contango markets, where futures trade above spot due to storage costs, persistent physical buying can narrow basis and push spot higher.
U.S. investors tracking GLD or iShares Gold Trust (IAU) should note that ETF flows often lag spot moves but amplify them through arbitrage. Recent data shows inflows supporting the rally, as gold serves as an inflation hedge when CPI expectations rise.
Key Drivers: Inflation and Dollar Dynamics
Gold’s ascent ties directly to U.S. inflation fears, where higher CPI erodes real yields and boosts non-yielding assets like gold. The transmission mechanism is straightforward: as real 10-year Treasury yields fall (nominal yields minus inflation), gold becomes relatively attractive. Concurrently, a softening U.S. dollar—tracked via DXY—amplifies gold’s appeal for international buyers, as most global gold is priced in dollars.
Over the past year, gold has risen more than 25% since early 2025, driven by these factors plus geopolitical tensions. For American portfolios, this reinforces gold’s diversification value, with experts recommending 5-10% allocation amid Fed policy uncertainty.
Spot vs. Futures: Market Structure Insights
Distinguishing spot from COMEX front-month futures is crucial. On April 13, 2026, spot closed at $4,667.94, down 1.78% that day, showing intraday volatility before rebounding. Futures often lead due to leverage and spec positioning, but spot reflects actual delivery demand. Current contango suggests storage costs, yet physical tightness keeps spot resilient.
U.S. traders on CME watch CFTC commitment of traders reports for net longs, which if elevated, can signal topping risks. However, central bank buying—over 1,000 tonnes annually—supports floor prices.
Broader Precious Metals Context
Gold’s move aligns with silver at $78 and platinum at $2,068 per ounce as of April 14 morning ET. The gold-silver ratio at around 63 indicates silver’s relative underperformance, offering opportunities for U.S. investors in diversified precious metals exposure via ETFs like SLV.
Palladium at $1,553 lags, reflecting auto sector weakness, but gold’s dominance underscores its safe-haven primacy during risk-off periods.
U.S. Investor Implications and Risks
For U.S. investors, gold at these levels impacts retirement accounts via gold IRAs and tactical allocations. Volatility remains: spreads between bid and ask tighten in high-demand phases, signaling liquidity, but sharp reversals can occur on strong economic data.
Risks include Fed rate hikes strengthening the dollar or yields, pressuring gold lower. Yet, with inflation sticky, the upside bias persists. Positioning via futures requires margin awareness, while spot exposure via ETFs offers simplicity.
Historical Perspective and Long-Term Outlook
Gold’s path to $4,781 builds on decades as a store of value. From $2,000 in 2020 to current highs, compounding at 20%+ annually rewards patient holders. U.S. investors benefit from tax-advantaged vehicles, but transaction costs in physical gold warrant caution.
Looking ahead, monitor April CPI release and Fed minutes for yield clues. Central bank purchases from China and India provide tailwinds, sustaining demand.
Trading Spreads and Liquidity Metrics
In gold trading, the bid-ask spread measures liquidity: narrower spreads denote robust demand. Current tight spreads affirm market depth, encouraging larger positions for institutions. U.S. retail via platforms like APMEX sees firm premiums, validating spot strength.
ETF Flows and Institutional Activity
SPDR Gold Trust holdings, a proxy for ETF demand, correlate with spot. Recent inflows coincide with the rally, as pensions allocate amid equity volatility. For U.S. investors, GLD’s liquidity makes it ideal for tactical trades.
Geopolitical and Macro Tailwinds
Beyond economics, ongoing tensions bolster safe-haven flows. Gold’s low correlation to stocks (often negative) enhances portfolio Sharpe ratios, per Vanguard research analogs.
Practical Access for U.S. Investors
Options abound: physical via dealers, ETFs, futures, or miners (though latter track equities). Spot tracking via apps ensures real-time awareness, vital for rebalancing.
Further Reading
Fortune: Current Gold Price Update
GoldPrice.org: April 13 Data
USAGOLD: Physical Market Report
Disclaimer: Not investment advice. Commodities and financial instruments are volatile.


Leave a comment